
American consumer confidence declined in early October, as households grew more pessimistic about current conditions and the broader economic outlook, according to preliminary data from the University of Michigan.
The closely watched Consumer Sentiment Index is expected to weaken to 46.3 from 48.1 in September, missing economists’ expectations of 47.3 and signalling a slightly worse backdrop for public confidence.
Furthermore, the Current Conditions index dropped to 44.7 from 50.9, while the Expectations gauge rose to 47.3 from 46.3, highlighting some change of view regarding the months ahead.
Inflation expectations, meanwhile, increased. The one-year outlook ticked higher to 4.7% from 4.6%, and the five-year forecast climbed to 3.5% from 3.4%, suggesting that consumers are seeing some strengthening momentum in price pressures, in line with recent inflation data.
Market reaction
The US Dollar remains well bid amid the widespread offered stance in the risk-associated universe, with the US Dollar Index (DXY) navigating the 102.30 region in the wake of the data release, reversing Thursday’s retracement.
US Dollar Price Today
The table below shows the percentage change of US Dollar (USD) against listed major currencies today. US Dollar was the strongest against the Canadian Dollar.
| USD | EUR | GBP | JPY | CAD | AUD | NZD | CHF | |
|---|---|---|---|---|---|---|---|---|
| USD | 0.18% | 0.05% | 0.30% | 0.39% | -0.19% | 0.00% | -0.07% | |
| EUR | -0.18% | -0.12% | 0.14% | 0.21% | -0.35% | -0.14% | -0.26% | |
| GBP | -0.05% | 0.12% | 0.25% | 0.37% | -0.24% | -0.01% | -0.07% | |
| JPY | -0.30% | -0.14% | -0.25% | 0.10% | -0.49% | -0.28% | -0.33% | |
| CAD | -0.39% | -0.21% | -0.37% | -0.10% | -0.61% | -0.39% | -0.43% | |
| AUD | 0.19% | 0.35% | 0.24% | 0.49% | 0.61% | 0.22% | 0.19% | |
| NZD | -0.01% | 0.14% | 0.00% | 0.28% | 0.39% | -0.22% | -0.05% | |
| CHF | 0.07% | 0.26% | 0.07% | 0.33% | 0.43% | -0.19% | 0.05% |
The heat map shows percentage changes of major currencies against each other. The base currency is picked from the left column, while the quote currency is picked from the top row. For example, if you pick the US Dollar from the left column and move along the horizontal line to the Japanese Yen, the percentage change displayed in the box will represent USD (base)/JPY (quote).
(This story was corrected on October 9 at 14:59 GMT to say that the September Consumer Sentiment Index print was 48.1 instead of 47.6)
This section below was published as a preview of the preliminary print of the University of Michigan Consumer Sentiment for October at 12:30 GMT.
- The Preliminary Michigan Consumer Sentiment Index is forecast to decline for a third consecutive month in October.
- Crude Oil prices picked up ahead of the release amid concerns of renewed Middle East tensions.
- The US Dollar Index maintains upward pressure near its 2026 peak in the 102.50 region ahead of the release.
The University of Michigan (UoM) will release the preliminary estimate of the United States (US) October Consumer Sentiment Index on Friday. The UoM report, which analyses US consumers’ feelings about their personal finances, business conditions, and purchasing plans, is expected to decline for a third consecutive month, as market analysts anticipate a reading of 47.6 following the 48.1 printed in September. The September reading was the second-lowest historical level, barely above the historic low of 44.8 posted in May.
Alongside headline Consumer Sentiment, the UoM releases 1-year and 5-year Consumer Inflation Expectations, currently at 4.6% and 3.4%, respectively. The Federal Reserve (Fed) vouches for inflation to remain around 2%, hence, the recent decision to tighten monetary policy by hiking the benchmark interest rate by 25 basis points (bps). Indeed, UoM’s report is nothing more than a reflection of consumers’ expectations of price pressures and is far from an official figure. Still, the numbers reflect American reality as the Middle East war pushes energy prices higher.
What to expect from October’s UoM Consumer Sentiment Index report?
The Middle East war has been the market’s main driver. What started as a conflict between Iran and Israel ended up being a regional crisis that includes the US. The blockage of the Strait of Hormuz resulted in Oil prices soaring to multi-year highs and resulting in outrageous energy-related inflation. The conflict, which started in February, has seen different stages, with hopes for a quick resolution fading as time goes by.
Investors remain distrustful despite crude Oil flows in the Persian Gulf returning to near pre-war levels. Oil prices are back up, with West Texas Intermediate (WTI) futures up roughly 5% on Thursday after US President Donald Trump said he no longer wants a deal with Iran, while discussing resuming large-scale military operations on Iran in the upcoming weeks.
His comments do little to build confidence among Americans seeing persistently elevated energy and food prices. Still, it’s worth mentioning that price pressures moved off their yearly peaks. The latest Personal Consumption Expenditures (PCE) Price Index rose a seasonally adjusted 3.4% in the year to August, down from the 4% posted earlier in the year. Core PCE during the same period rose 3%, still above the Fed’s goal but again easing from its 2026 peak.
The recent spike in Oil prices is likely to maintain inflation expectations elevated and hence, confidence subdued.
When will the UoM Consumer Sentiment Index be released, and how could it affect the US Dollar?
The University of Michigan will release the Consumer Sentiment Index and Consumer Inflation Expectations on Friday at 14:00 GMT. As previously noted, market players anticipate sentiment will continue to deteriorate in October. Ahead of the announcement, the US Dollar Index (DXY) holds well above the 102 mark, not far below this year’s peak achieved in October at 102.53.
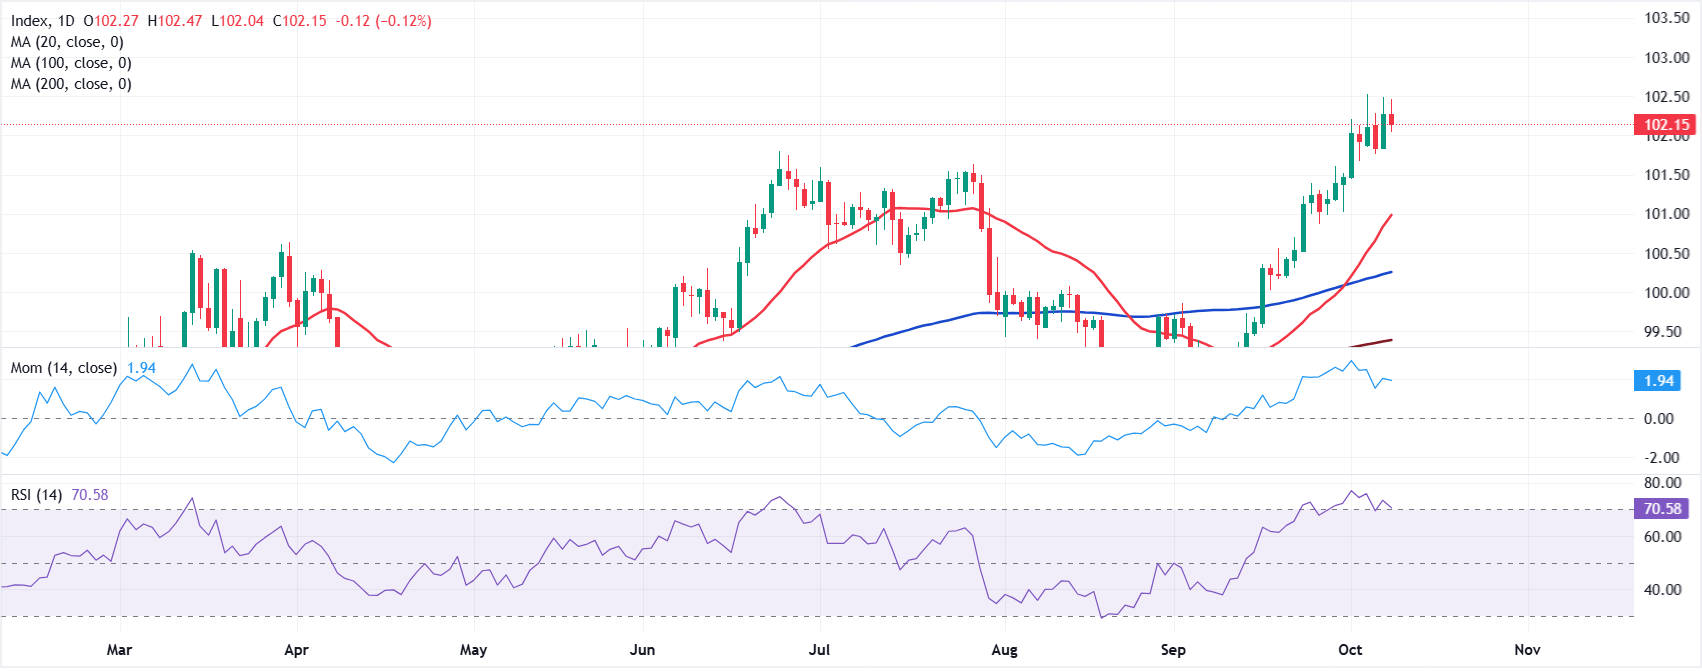
Valeria Bednarik, Chief Analyst at FXStreet, notes: “The US Dollar (USD) benefits from both risk aversion amid fears of an escalation of the Middle East war and speculation that the Fed will have to hike interest rates again before the year ends. From a technical perspective, and according to the daily chart, the DXY is overbought but still bullish. The Relative Strength Index (RSI) indicator consolidates at extremes, yet off its recent peak. Furthermore, the index develops above all its moving averages, with the shorter 20-day Simple Moving Average (SMA) accelerating north after crossing above the longer 100-day and 200-day SMAs, usually a sign of building directional momentum.”
Bednarik adds: “The mentioned peak in the 102.50 region provides immediate resistance, with gains beyond it exposing the 103.00 threshold ahead of the 103.45 area. The weekly low at 101.76 is the first support level to watch, with additional declines exposing the 101.30 price zone. The closer the index approaches 101.00, the higher the chances buyers reappear.”
US Dollar FAQs
The US Dollar (USD) is the official currency of the United States of America, and the ‘de facto’ currency of a significant number of other countries where it is found in circulation alongside local notes. It is the most heavily traded currency in the world, accounting for over 88% of all global foreign exchange turnover, or an average of $6.6 trillion in transactions per day, according to data from 2022. Following the second world war, the USD took over from the British Pound as the world’s reserve currency. For most of its history, the US Dollar was backed by Gold, until the Bretton Woods Agreement in 1971 when the Gold Standard went away.
The most important single factor impacting on the value of the US Dollar is monetary policy, which is shaped by the Federal Reserve (Fed). The Fed has two mandates: to achieve price stability (control inflation) and foster full employment. Its primary tool to achieve these two goals is by adjusting interest rates. When prices are rising too quickly and inflation is above the Fed’s 2% target, the Fed will raise rates, which helps the USD value. When inflation falls below 2% or the Unemployment Rate is too high, the Fed may lower interest rates, which weighs on the Greenback.
In extreme situations, the Federal Reserve can also print more Dollars and enact quantitative easing (QE). QE is the process by which the Fed substantially increases the flow of credit in a stuck financial system. It is a non-standard policy measure used when credit has dried up because banks will not lend to each other (out of the fear of counterparty default). It is a last resort when simply lowering interest rates is unlikely to achieve the necessary result. It was the Fed’s weapon of choice to combat the credit crunch that occurred during the Great Financial Crisis in 2008. It involves the Fed printing more Dollars and using them to buy US government bonds predominantly from financial institutions. QE usually leads to a weaker US Dollar.
Quantitative tightening (QT) is the reverse process whereby the Federal Reserve stops buying bonds from financial institutions and does not reinvest the principal from the bonds it holds maturing in new purchases. It is usually positive for the US Dollar.
Economic Indicator
Michigan Consumer Sentiment Index
The Michigan Consumer Sentiment Index, released on a monthly basis by the University of Michigan, is a survey gauging sentiment among consumers in the United States. The questions cover three broad areas: personal finances, business conditions and buying conditions. The data shows a picture of whether or not consumers are willing to spend money, a key factor as consumer spending is a major driver of the US economy. The University of Michigan survey has proven to be an accurate indicator of the future course of the US economy. The survey publishes a preliminary, mid-month reading and a final print at the end of the month. Generally, a high reading is bullish for the US Dollar (USD), while a low reading is bearish.
Read more.Next release: Fri Oct 09, 2026 14:00 (Prel)
Frequency: Monthly
Consensus: 47.6
Previous: 48.1
Source: University of Michigan
Consumer exuberance can translate into greater spending and faster economic growth, implying a stronger labor market and a potential pick-up in inflation, helping turn the Fed hawkish. This survey’s popularity among analysts (mentioned more frequently than CB Consumer Confidence) is justified because the data here includes interviews conducted up to a day or two before the official release, making it a timely measure of consumer mood, but foremost because it gauges consumer attitudes on financial and income situations. Actual figures beating consensus tend to be USD bullish.