
Annual inflation in the United States (US), as measured by the change in the Personal Consumption Expenditures (PCE) Price Index, held steady at 3.4% in August, the US Bureau of Economic Analysis (BEA) reported on Wednesday. This reading came in below the market expectation of 3.7%, while July's print was revised lower to 3.4% from 3.7%.
In this period, the core PCE Price Index, which excludes volatile food and energy prices, stood unchanged at 3% and came in below analysts' estimate of 3.3%. Similarly, July's reading was also revised lower to 3% from 3.3%.
On a monthly basis, the PCE Price Index and the core PCE Price Index increased by 0.3% and 0.2%, respectively.
Other details of the publication showed that Personal Income rose by 0.2% on a monthly basis in August, while Personal Spending expanded by 0.9%.
Market reaction to US PCE inflation data
The US Dollar (USD) came under renewed selling pressure with the immediate reaction. At the time of press, the USD Index was down 0.3% on the day at 101.05.
US Dollar Price Today
The table below shows the percentage change of US Dollar (USD) against listed major currencies today. US Dollar was the weakest against the British Pound.
| USD | EUR | GBP | JPY | CAD | AUD | NZD | CHF | |
|---|---|---|---|---|---|---|---|---|
| USD | -0.29% | -0.54% | -0.28% | -0.21% | 0.04% | -0.34% | -0.18% | |
| EUR | 0.29% | -0.22% | 0.00% | 0.08% | 0.32% | -0.05% | 0.11% | |
| GBP | 0.54% | 0.22% | 0.23% | 0.32% | 0.55% | 0.20% | 0.36% | |
| JPY | 0.28% | 0.00% | -0.23% | 0.06% | 0.32% | -0.07% | 0.12% | |
| CAD | 0.21% | -0.08% | -0.32% | -0.06% | 0.26% | -0.13% | 0.05% | |
| AUD | -0.04% | -0.32% | -0.55% | -0.32% | -0.26% | -0.38% | -0.20% | |
| NZD | 0.34% | 0.05% | -0.20% | 0.07% | 0.13% | 0.38% | 0.17% | |
| CHF | 0.18% | -0.11% | -0.36% | -0.12% | -0.05% | 0.20% | -0.17% |
The heat map shows percentage changes of major currencies against each other. The base currency is picked from the left column, while the quote currency is picked from the top row. For example, if you pick the US Dollar from the left column and move along the horizontal line to the Japanese Yen, the percentage change displayed in the box will represent USD (base)/JPY (quote).
Developing story, please refresh the page for updates.
This section below was published as a preview of the US PCE inflation data at 08:00 GMT.
- The core Personal Consumption Expenditures Price Index is forecast to rise 0.3% MoM and 3.4% YoY in August.
- Headline annual PCE inflation is expected to remain stable at 3.7%.
- EUR/USD is bearish near 2026 lows ahead of the critical data release.
The United States (US) Bureau of Economic Analysis (BEA) will publish the Personal Consumption Expenditures (PCE) Price Index data for August on Wednesday at 12:30 GMT. Market participants closely watch the PCE Price Index because it is the Federal Reserve’s (Fed) preferred measure of inflation and could influence its policy outlook.
PCE inflation: Insights into the Federal Reserve's key inflation metric
Market participants anticipate that the core PCE Price Index, which excludes volatile food and energy prices, advanced 0.3% month-over-month (MoM) in August, following the 0.2% increase recorded in July, while the annualized reading is foreseen at 3.4%, slightly higher than the 3.3% posted in the previous month.
As previously noted, PCE inflation data is critical as it’s the Fed’s preferred inflation gauge and will help market participants move bets on whatever the central bank may do in the last two meetings of the year. It’s worth remembering that policymakers delivered a 25 basis points (bps) interest rate hike when they met in September, the first one in three years, to a target range of 3.75%–4.00% in a unanimous decision.
The hike explains itself: the Middle East war maintains energy prices upward, pressuring the cost of living, while PCE inflation hit 4% in early 2026, doubling the central bank’s goal. Sure, inflationary pressures have receded from that level, but they are still far from the comfortable 2%.
At the same time, crude Oil prices are roughly 50% higher than pre-war, while the conflict is far from resolving and has become a regional crisis with more and more countries involved. On a positive note, Oil flows through the Strait of Hormuz recovered to about 80% of pre-war levels in September, despite continued military tensions in the region.
The risk of an escalation, however, remains high and market participants are far from pricing in easing energy prices in the foreseeable future. That means inflation is likely to hold above the preferred 2% and hence, result in some Fed action to tame it.
Ahead of the PCE Price Index release, market participants expect interest rate hikes both in October and December, according to the FedWatch Tool. The odds for an October hike stand at 72.5% at the time of writing.
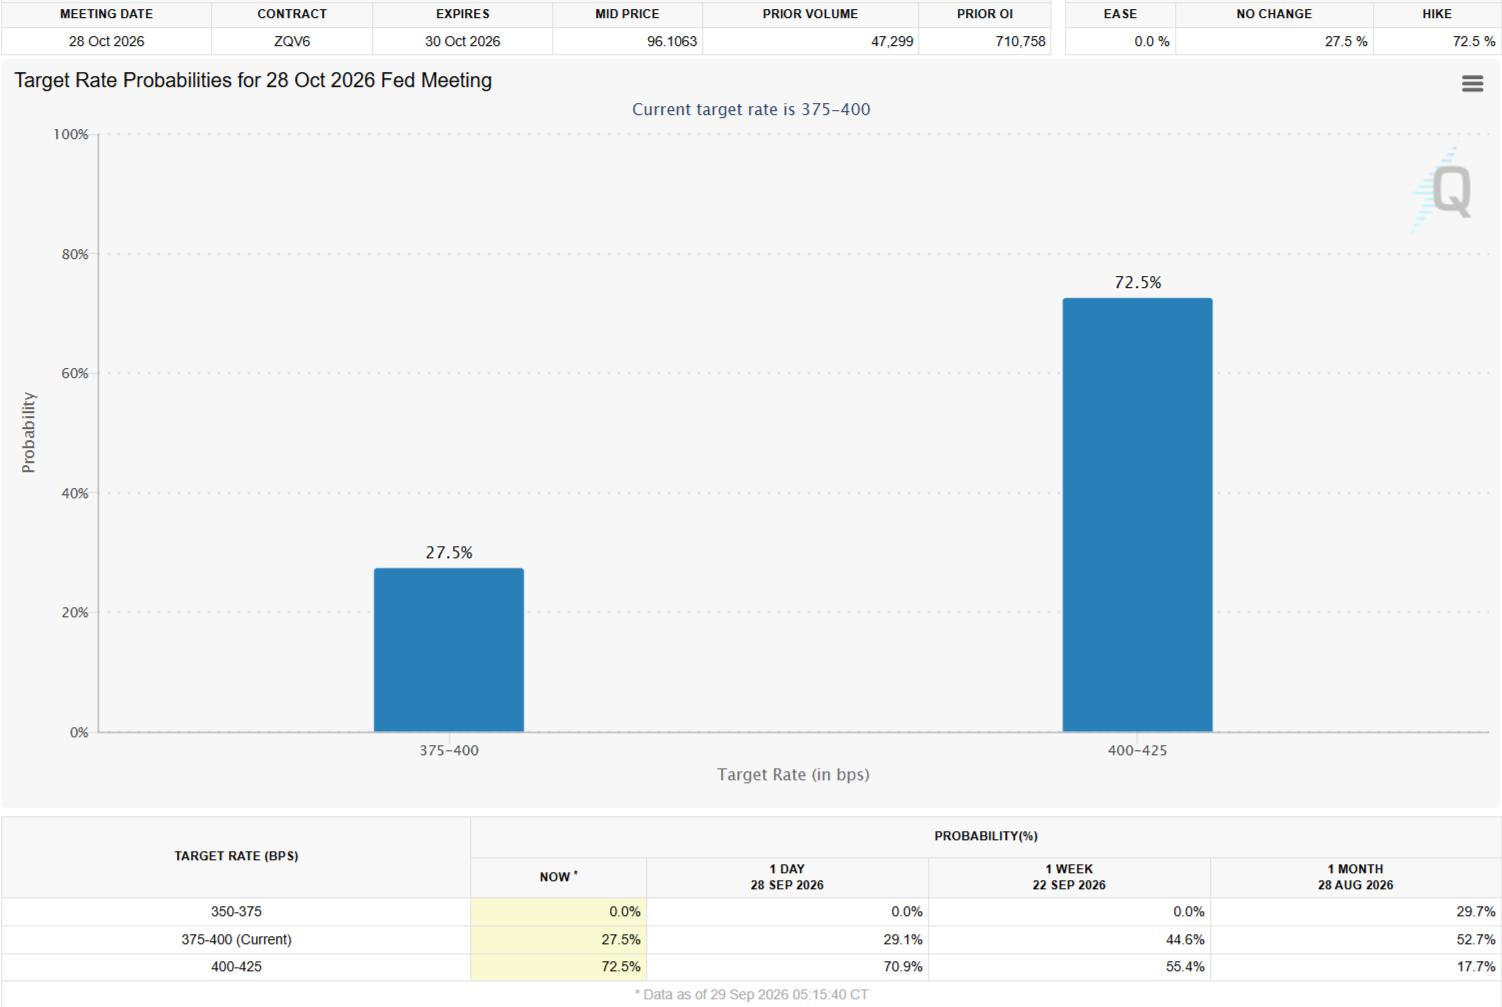
Generally, a higher-than-anticipated PCE Price Index result should boost the odds for upcoming rate hikes, increasing demand for the US Dollar (USD). A reading in line with the market’s expectation should have a limited impact on prices, yet maintain the USD on its bullish route. On the contrary, a lower-than-anticipated outcome should put some pressure on the Greenback, at least temporarily.
How will the Personal Consumption Expenditures Price Index affect EUR/USD?
As the release approaches, the US Dollar Index (DXY) trades not far below its yearly peak at 101.80, maintaining its positive momentum as investors bet on higher interest rates while seeing no easy way out of the Middle East conflict.
Valeria Bednarik, Chief Analyst at FXStreet, notes: “The EUR/USD pair trades in the 1.1350 price zone, with a clear bearish bias and without signs of downward exhaustion. The pair develops far below all its Simple Moving Averages (SMAs), while the 20-day SMA crosses below an also bearish 100-day SMA, usually a sign of strong selling interest. At the same time, technical indicators maintain their downward slopes well into negative territory, also reflecting sellers’ control.”
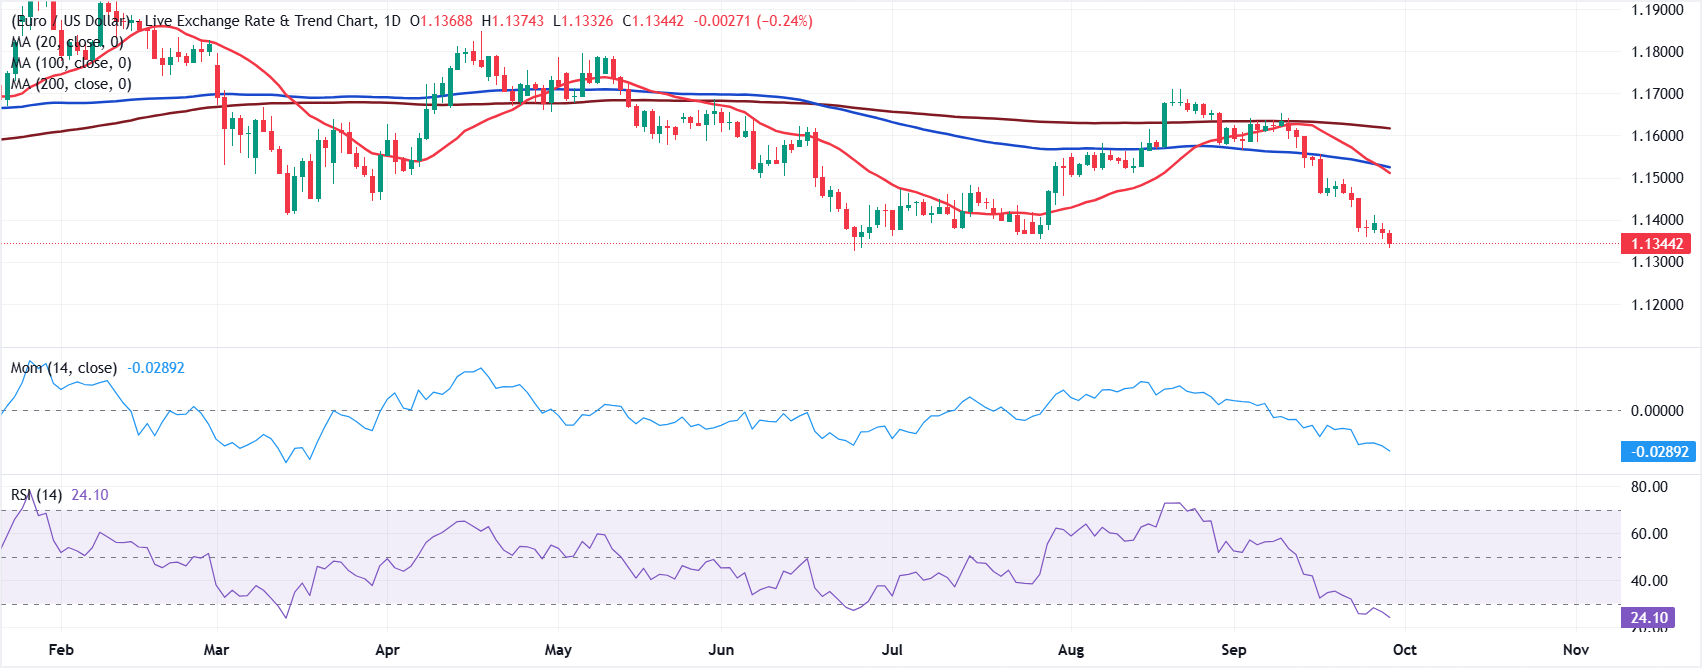
Bednarik adds: “June monthly low at 1.1324 provides immediate support ahead of the 1.1200 price zone, where the pair topped between August and September 2025 multiple times. Once below the area, the case for additional declines will strengthen. Resistance can be found at 1.1400, while additional gains expose a long-term static area around 1.1470. Sellers are likely to reappear around the latter if reached, limiting any additional bullish potential.”
Fed FAQs
Monetary policy in the US is shaped by the Federal Reserve (Fed). The Fed has two mandates: to achieve price stability and foster full employment. Its primary tool to achieve these goals is by adjusting interest rates. When prices are rising too quickly and inflation is above the Fed’s 2% target, it raises interest rates, increasing borrowing costs throughout the economy. This results in a stronger US Dollar (USD) as it makes the US a more attractive place for international investors to park their money. When inflation falls below 2% or the Unemployment Rate is too high, the Fed may lower interest rates to encourage borrowing, which weighs on the Greenback.
The Federal Reserve (Fed) holds eight policy meetings a year, where the Federal Open Market Committee (FOMC) assesses economic conditions and makes monetary policy decisions. The FOMC is attended by twelve Fed officials – the seven members of the Board of Governors, the president of the Federal Reserve Bank of New York, and four of the remaining eleven regional Reserve Bank presidents, who serve one-year terms on a rotating basis.
In extreme situations, the Federal Reserve may resort to a policy named Quantitative Easing (QE). QE is the process by which the Fed substantially increases the flow of credit in a stuck financial system. It is a non-standard policy measure used during crises or when inflation is extremely low. It was the Fed’s weapon of choice during the Great Financial Crisis in 2008. It involves the Fed printing more Dollars and using them to buy high grade bonds from financial institutions. QE usually weakens the US Dollar.
Quantitative tightening (QT) is the reverse process of QE, whereby the Federal Reserve stops buying bonds from financial institutions and does not reinvest the principal from the bonds it holds maturing, to purchase new bonds. It is usually positive for the value of the US Dollar.
Economic Indicator
Core Personal Consumption Expenditures - Price Index (MoM)
The Core Personal Consumption Expenditures (PCE), released by the US Bureau of Economic Analysis on a monthly basis, measures the changes in the prices of goods and services purchased by consumers in the United States (US). The PCE Price Index is also the Federal Reserve’s (Fed) preferred gauge of inflation. The MoM figure compares the prices of goods in the reference month to the previous month.The core reading excludes the so-called more volatile food and energy components to give a more accurate measurement of price pressures. Generally, a high reading is bullish for the US Dollar (USD), while a low reading is bearish.
Read more.Next release: Wed Sep 30, 2026 12:30
Frequency: Monthly
Consensus: 0.3%
Previous: 0.2%
Source: US Bureau of Economic Analysis
After publishing the GDP report, the US Bureau of Economic Analysis releases the Personal Consumption Expenditures (PCE) Price Index data alongside the monthly changes in Personal Spending and Personal Income. FOMC policymakers use the annual Core PCE Price Index, which excludes volatile food and energy prices, as their primary gauge of inflation. A stronger-than-expected reading could help the USD outperform its rivals as it would hint at a possible hawkish shift in the Fed’s forward guidance and vice versa.