As two major crude oil markets, Brent and WTI (West Texas Intermediate) often move in the same direction, but they do not always respond equally to the same news. US inventory reports can put WTI in focus, while international supply disruptions have a more direct influence on Brent.
For beginners, choosing between them is not simply about predicting which oil price will rise faster. Contract size, trading costs, leverage and entry timing can all change the outcome of a trade.
To make the comparison more practical, this guide uses observed Brent and WTI quotes from IG, alongside hypothetical trading scenarios, to explain how the two markets differ and what beginners should check before opening a position.
Brent vs. WTI: What Are the Main Differences?
Brent is a benchmark for crude oil produced in the North Sea and is widely used to price internationally traded oil. WTI is a US crude oil benchmark closely associated with American production, inventories and the Cushing, Oklahoma, delivery hub.
Both are light, relatively low-sulfur crude oils. Yet their prices can respond differently to changes in supply, demand and transportation conditions.
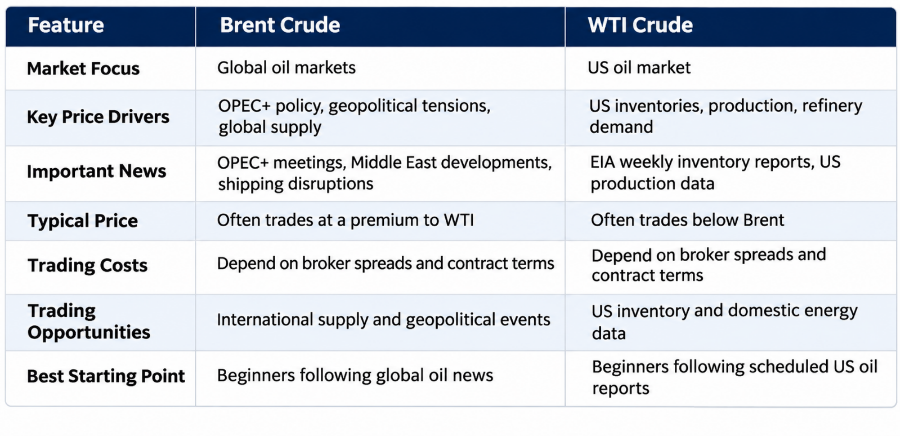
These differences are useful, but they are not absolute. A disruption in the Middle East can affect both benchmarks, while an unexpected change in US inventories can influence international oil prices.
The better question is which benchmark responds most directly to the information a trader understands and follows.
Spot Oil CFDs VS Oil Futures: What Should Beginners Know?
Choosing between Brent and WTI is only part of the decision. The product used to trade the benchmark can also change the cost of holding a position.
Spot oil CFDs are broker-issued derivatives that allow traders to speculate on oil price movements without owning physical crude. They commonly have no fixed expiry date and may support relatively small position sizes.
However, holding these positions overnight can result in financing adjustments.
Exchange-traded oil futures are standardized contracts with specified expiry dates. Traders maintaining exposure beyond an approaching expiry generally need to close or roll their position into a later contract.
Futures do not normally carry the same separately charged daily financing fee as spot-style CFDs, but their prices reflect financing, storage and other market factors. Commissions, bid-ask spreads, margin requirements and contract expiry also affect trading costs.
A futures-based CFD is different again. It is a broker-issued derivative linked to an underlying futures contract, with expiry and rollover arrangements determined by the provider.
Why Holding Period Matters
Suppose a trader holds a 100-barrel spot-style oil CFD position for ten nights.
If the broker charges a hypothetical financing fee of $0.03 per barrel per night, the total would be:
100 barrels × $0.03 × 10 nights = $30
That is $30 in financing charges before accounting for the spread and any other costs.
For a position closed before the financing cutoff, the charge might not apply. For a longer-term trade, holding costs could reduce the final return even if the oil price moves in the expected direction.
Futures introduce another consideration: the relationship between delivery months.
When later-dated contracts trade above nearer-dated contracts, the market is in contango. When later contracts trade below nearer ones, it is in backwardation.
These price relationships affect the economics of maintaining futures exposure, but the gap between contract prices should not be treated as an immediate cash loss equal to the entire difference.
For beginners, the right comparison is the total cost of holding a specific position for a specific period.
How to Choose Between Brent and WTI: News, Strategy and Timing
Breaking News: Which Oil Reacts More Strongly?
Brent and WTI often move in the same direction, but the same news can affect them differently. The key is understanding where the disruption occurs and which oil market faces the greater change in supply or demand.
Take the November 2026 US midterm elections. According to TradingKey, Brent fell by around 10% intraday on November 4, reaching $93.22 per barrel, while WTI declined more than 9.3% to $87.13. The sell-off followed expectations that political developments could reduce tensions between the US and Iran, removing some of the geopolitical risk premium from oil prices.
Brent's slightly larger decline was consistent with its closer connection to international supply risks. However, the difference in performance was relatively small, and both benchmarks were affected by broader market expectations.
For beginners, the nature of the news offers a useful source. US inventory reports, refinery activity, and production figures provide reasons to monitor WTI closely. OPEC+ decisions, Middle Eastern conflicts and disruptions to international shipping make Brent particularly relevant.
The more revealing question is not simply which price moves further, but whether the Brent-WTI price difference changes. That can help traders distinguish a market-specific reaction from a broader shift in oil prices.
Trading Strategy: Which Oil Fits Your Approach?
Choosing between Brent and WTI also depends on how a trader intends to profit from price movements. A market that suits a news trader may be less attractive to someone holding a position for several days.
For news trading, WTI provides a regular event to follow: the weekly US Energy Information Administration (EIA) inventory report. Traders can compare actual inventory changes with forecasts and watch how prices respond. Brent may be more relevant when the trading idea concerns international supply disruptions or OPEC+ production decisions. Neither market guarantees a clearer reaction, especially when the news is already reflected in prices.
For day trading, transaction costs become more important. Suppose a trader buys 10 barrels of Brent or WTI and targets a $0.50-per-barrel increase. With hypothetical spreads of $0.08 for Brent and $0.04 for WTI, the potential profit after spread costs would be $4.20 and $4.60, respectively. The difference looks small, but it becomes more meaningful across frequent trades.
Swing traders face a different calculation. Overnight financing, contract adjustments and the broader supply outlook may matter more than a few cents of spread.
The better choice is therefore the benchmark whose price behaviour and trading costs fit the intended holding period.
Trading Timing: When Does the Opportunity Change?
Even when traders identify the right news and choose a suitable strategy, entering at the wrong time can undermine the trade.
Consider the November oil sell-off. A trader who recognised the change in geopolitical expectations early would have faced a different opportunity from someone entering after Brent had already fallen sharply. The second trader might share the same bearish outlook, but much of the immediate price movement could already be over.
For example, suppose Brent falls from $100 to $94. A trader selling at $99 and closing at $94 earns $5 per barrel before costs. Another trader selling at $94, hoping for a further decline to $92, has only $2 per barrel of potential profit. If Brent rebounds to $97 instead, the second trader loses $3 per barrel.
Trading sessions also matter. News released during Asian hours may trigger an initial reaction, while European and US participants subsequently reassess its significance. Prices can extend their earlier move, consolidate or reverse. Neither Brent nor WTI is automatically the better choice simply because a particular session has opened.
Before entering, beginners should check how far the price has already moved, whether spreads have widened and how much potential profit remains relative to the planned stop-loss.
Sometimes the better decision is to wait rather than chase either market.
Real Broker Comparison: Brent vs. WTI Trading Costs
A comparison of actual broker quotes can reveal more than a general claim that one oil benchmark is cheaper to trade.
The following figures come from screenshots of IG's Brent Crude and US Crude trading pages provided for this article on November 6, 2026.
IG Brent and WTI: Real Market Quotes
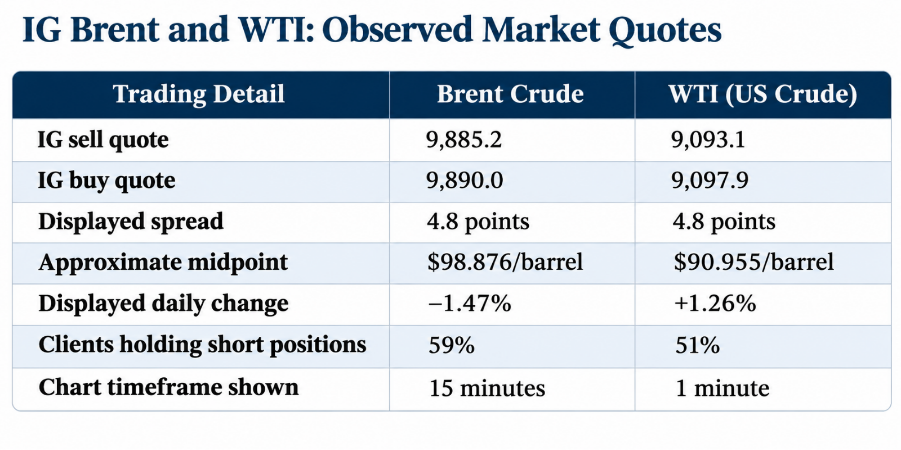
Source: IG trading-page screenshots supplied for this article, November 6, 2026. Prices are displayed in platform points, with 100 points corresponding to $1 per barrel. The screenshots are separate observations and should not be treated as synchronized market quotes. Figures are historical snapshots, not current dealing prices.
What Do the IG Quotes Tell Us?
The first observation is the price difference. Brent's approximate midpoint was $98.876 per barrel, compared with $90.955 for WTI—a difference of about $7.92 per barrel.
This is the Brent–WTI price spread, not the broker's trading spread.
The second observation is more interesting: both markets displayed the same bid-ask spread of 4.8 points, equivalent to approximately $0.048 per barrel.
In other words, WTI was cheaper per barrel, but its displayed transaction spread was not lower than Brent's in these screenshots.
Beginners sometimes assume that a lower oil price automatically means lower trading costs. IG's observed quotes show why that assumption can be misleading.
How Much Would the Spread Cost?
To compare the two quotes on an equal basis, suppose a trader takes exposure equivalent to 100 barrels in each market.
With an observed spread of $0.048 per barrel, the illustrative cost of crossing the full spread is:
100 barrels ×$0.048 = $4.80
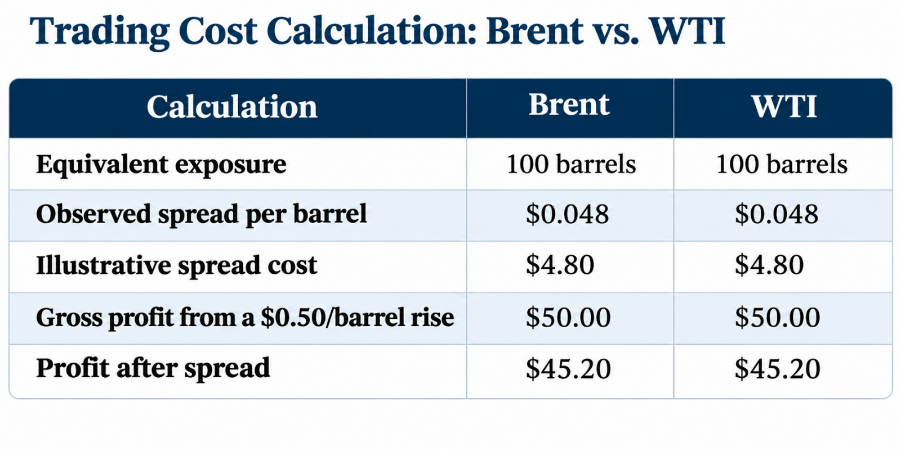
The calculation assumes an equivalent 100-barrel exposure, an unchanged spread and a $0.50-per-barrel favourable price movement measured against the initial midpoint. It excludes commissions, financing, slippage and other charges. The position size is illustrative and does not establish that IG offers a 100-barrel minimum or identical contract specifications in every region.
The result is straightforward. Under these assumptions, both trades produce the same dollar profit after the spread.
WTI's lower underlying price does not create a spread-cost advantage when the quantity traded and the spread per barrel are the same.
Actual costs can change with market conditions. IG publishes standard spreads for oil products, but these are not fixed guarantees. A live quote may be wider or narrower than the published standard.
Brent vs. WTI: Margin and Risk Compared
Trading costs are only one part of the calculation. Beginners also need to understand how much money is exposed to price movements. Using the approximate IG midpoint prices above, consider a hypothetical 100-barrel position in each benchmark with 200:1 leverage.
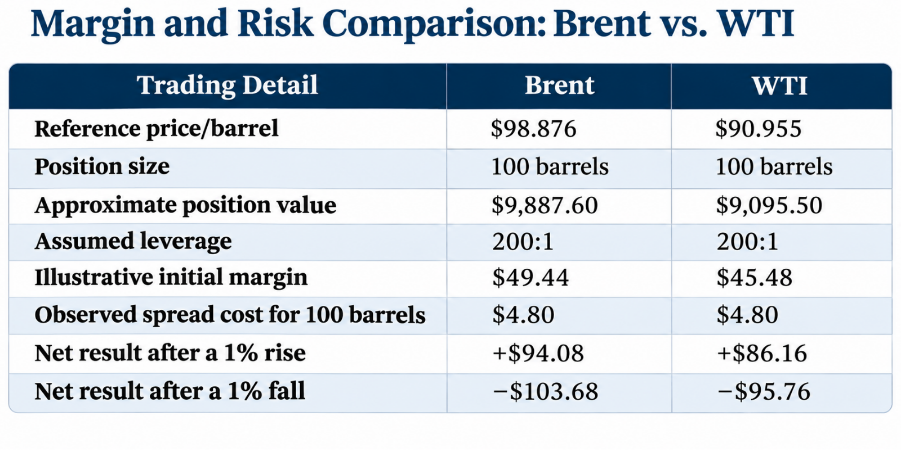
The 200:1 leverage ratio is a hypothetical assumption, not an IG margin quotation. The calculations use the approximate midpoints from the supplied screenshots and assume a constant spread. Results exclude overnight charges, commissions and slippage.
The WTI position requires slightly less margin because its underlying value is lower.
But lower margin does not mean lower risk.
A 1% decline in Brent produces a larger dollar loss in this example partly because the initial position value is higher. The comparison uses the same number of barrels, not the same dollar exposure.
More importantly, at 200:1 leverage, a 1% adverse move creates a gross loss equal to twice the initial margin on either position.
Actual broker margin requirements may be much higher, and margin close-out rules can force a position to close before a trader's planned exit.
For beginners, the more useful approach is to determine an acceptable dollar loss first, then calculate the position size that fits that limit.
Three Common Mistakes Beginners Make When Trading Oil
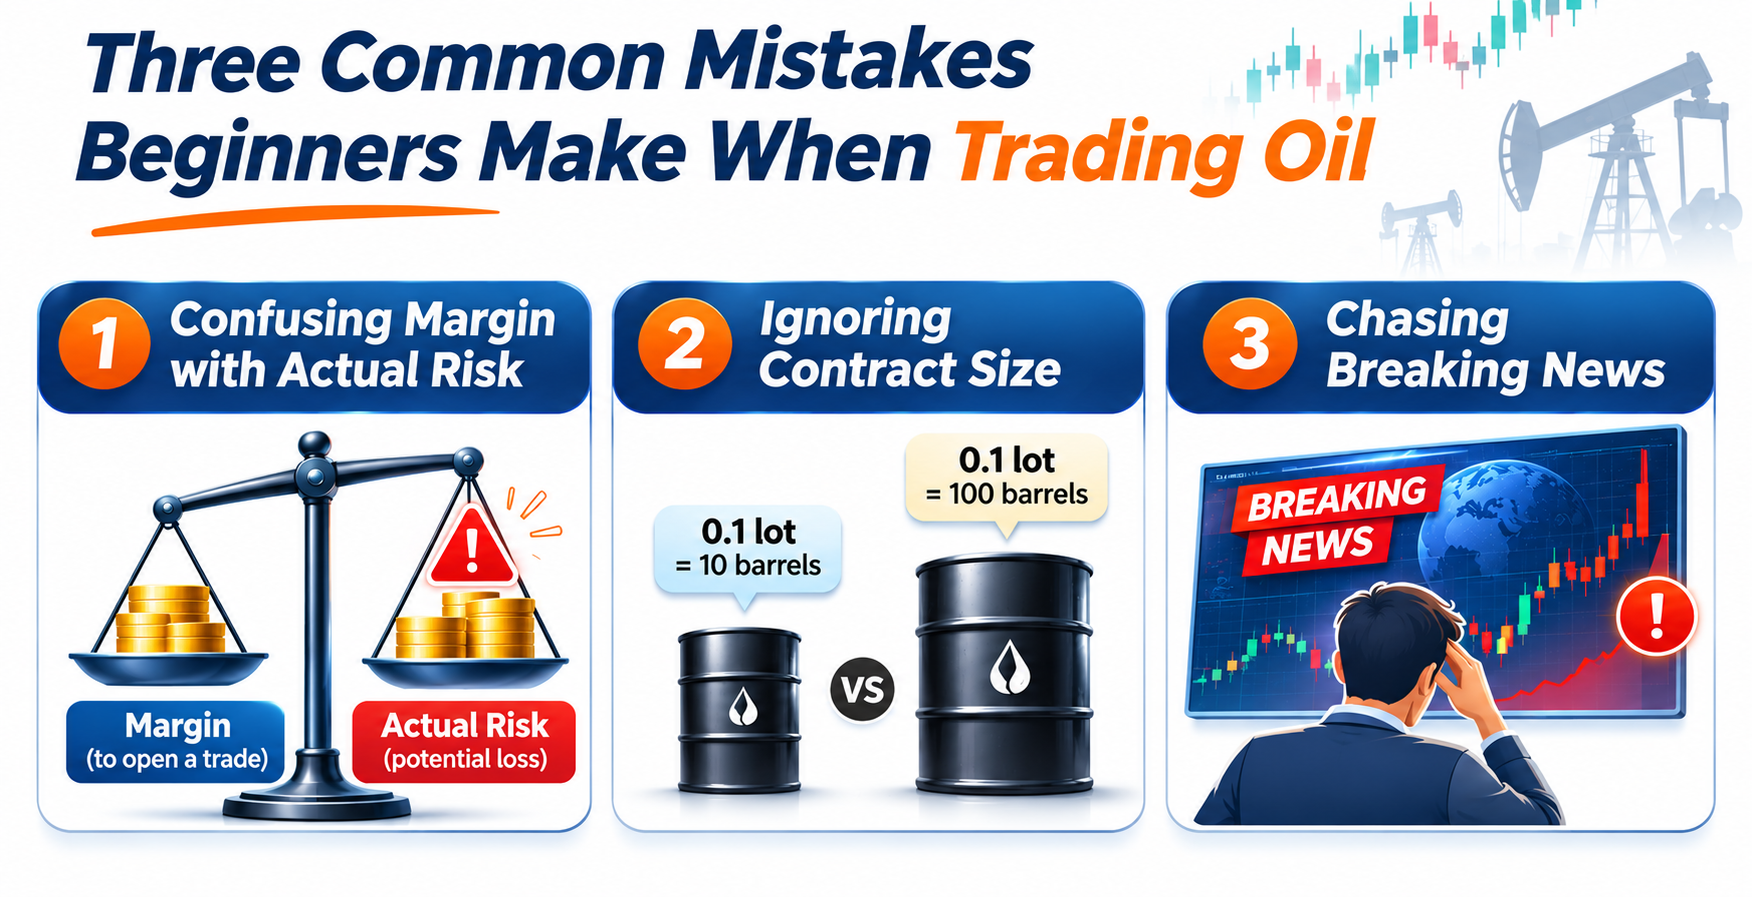
Confusing Margin with Actual Risk
A small margin requirement can make oil trading appear cheaper and safer than it really is. But margin is simply the amount needed to open a position, not the maximum amount a trader can lose.
Consider buying 100 barrels of WTI at approximately $90.96 with hypothetical 200:1 leverage.
The position is worth about $9,096, yet requires only around $45.48 in initial margin.
A 1% price decline would produce a gross loss of approximately $90.96 before trading costs—twice the initial margin.
This is particularly important for small accounts. A trader focusing only on the amount needed to open the position may overlook how quickly losses can accumulate.
Leverage reduces the capital required to open a trade, not the size of the price exposure.
Ignoring Contract Size
A position of 0.1 lot does not necessarily represent the same amount of oil across brokers.
Suppose one broker defines a standard oil lot as 100 barrels, while another uses 1,000 barrels.
At the first broker, 0.1 lot represents 10 barrels. At the second, it represents 100 barrels.
If oil moves against the position by $1 per barrel, the first trade loses $10, while the second loses $100, excluding trading costs.
The lot number looks identical, but the dollar risk is ten times greater.
Before placing an order, beginners should check the contract size, minimum trading volume and dollar value of each price movement.
The number of barrels matters more than the lot figure alone.
Chasing Breaking News
Oil prices can react within minutes to OPEC+ announcements, US inventory reports or geopolitical developments. The danger for beginners is entering after the market has already made its largest move.
Suppose Brent falls from $100 to $94 following news of easing supply concerns.
A trader who sells at $99 and exits at $94 earns $5 per barrel before costs.
Another who enters at $94, expecting a further decline to $92, has only $2 per barrel of potential profit. If prices rebound to $97 instead, the late entrant loses $3 per barrel.
Both traders may interpret the news correctly, but their entry prices create different outcomes.
Spreads can also widen during major announcements, while fast-moving prices can cause orders to execute at less favourable levels than expected.
A correct market forecast is not enough. Beginners need to assess how much of the news is already reflected in prices and whether the remaining potential reward justifies the risk.
The Bottom Line
On Balance, WTI seems to be a more friendly option for beginners who want to start oil trading. While brent may be more relevant for traders who follow OPEC+ decisions, international shipping disruptions and geopolitical developments. However, neither benchmark is inherently safer or consistently cheaper.
For beginners, the first priority should be finding a position size small enough to manage. The next is understanding what drives the chosen benchmark and how much the trade will cost.
Choosing the right oil matters. Knowing how much money is at risk matters more.
Risk warning: Trading forex and CFDs involves significant risk and may result in losses that exceed expectations. Leverage magnifies both gains and losses. This article is for educational purposes only and does not constitute investment advice.
FAQs
Does Oil Trading involve higher trading costs compared with currency trading?
Oil Trading involves higher trading costs, depending on spreads, overnight fees and market conditions.
Is oil trading suitable for beginners?
Oil trading can suit beginners, but volatility and leverage require careful management.
Can I use $20 to start Oil trading?
Yes, some brokers offer low-barrier accounts for traders to trade oil.