
Introduction
Learning to trade can feel overwhelming when every chart contains different indicators, price patterns, and signals. For beginners, the challenge is not simply finding a strategy. It is understanding when a strategy works, what conditions invalidate it, and how to manage risk when the market behaves unexpectedly.
The good news is that traders do not need dozens of indicators to build a structured approach. Several foundational methods can help beginners interpret price movements and develop a consistent trading process.
In this guide, we explore five trading strategies for beginners: trend following, swing trading, breakout trading, support and resistance, and moving averages. Each strategy includes chart-reading guidance, potential entry conditions, exit considerations, and common mistakes to avoid.
Trend Following Strategy for Beginners
Trend following is based on the idea that a market moving consistently in one direction may continue doing so for some time. Rather than trying to predict an exact market top or bottom, traders look for opportunities to participate in an established trend.
How to Identify a Trend?
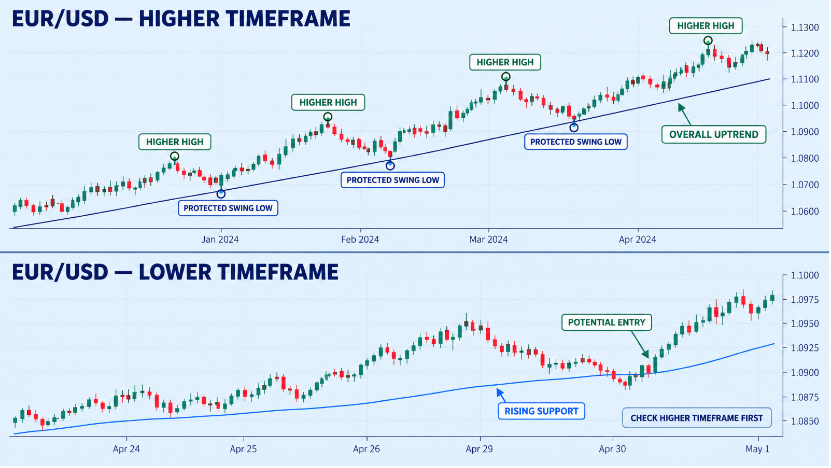
On a price chart, an uptrend typically forms higher highs and higher lows. A downtrend generally forms lower highs and lower lows.
For example, if EUR/USD repeatedly rises above previous swing highs and pulls back without breaking important swing lows, the market may be forming an uptrend. Beginners can start by examining the overall direction on a higher timeframe before looking for potential entries on a lower timeframe.
Entry and Exit Rules
A simple trend-following process could involve:
Identifying a clear upward or downward trend.
Waiting for a temporary pullback rather than chasing an extended price movement.
Looking for evidence that the prevailing direction is resuming.
Defining a stop-loss level beyond a meaningful swing point.
Setting an exit plan based on market structure or a predefined risk-to-reward framework.
For example, on a daily chart of the S&P 500, imagine the index forms a clear structural path over several weeks: it pushes up to 5,800, pulls back to 5,700 without breaking its previous swing low of 5,550, and then breaks out to a new high at 5,950.
A beginner practicing trend-following would first identify this higher-timeframe daily uptrend, then drop down to a 1-hour chart to wait for a routine intraday dip—such as a pullback to a rising moving average or a local support level—before executing a buy order in the direction of the primary trend.
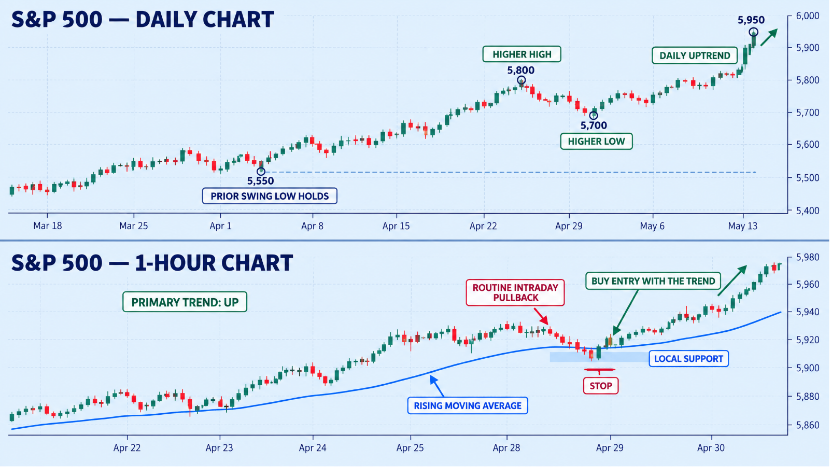
Why it works: The trade follows the prevailing trend rather than attempting to predict a reversal. The pullback offers a clearer reference point for managing risk, although the trend can still change unexpectedly.
Common Mistakes
The biggest mistake is entering after most of a move has already occurred. Beginners may also confuse a short-lived price spike with a sustainable trend.
Trend following generally becomes more difficult in sideways markets, where repeated reversals can trigger consecutive losses.
Swing Trading Strategies for Beginners
Swing trading aims to capture price movements that develop over several trading sessions or days. It may suit people who cannot monitor charts throughout the day, although it still requires planning and regular position monitoring.
How to Read the Chart
Swing traders often examine the four-hour and daily charts to identify meaningful price swings. Common reference points include previous highs and lows, support and resistance zones, and established trends.
A trader might observe that GBP/USD has been rising on the daily chart but has recently pulled back toward an earlier area of support.
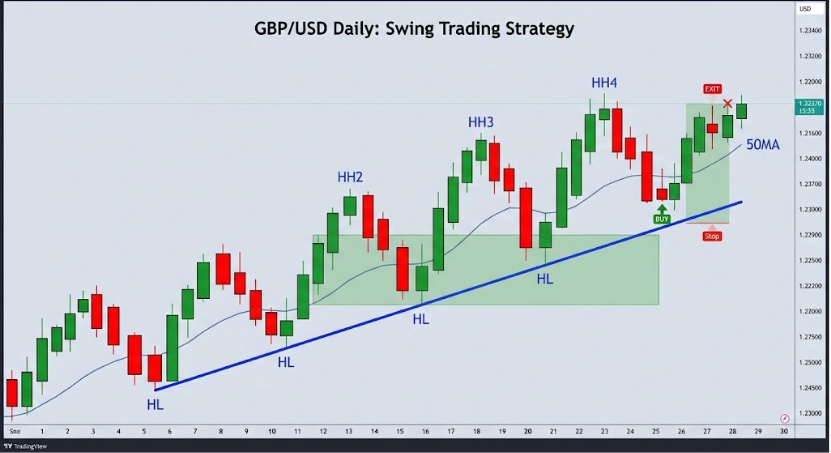
The key question is whether the pullback represents a temporary pause or the beginning of a larger reversal.
Entry and Exit Rules
A beginner-friendly swing-trading process includes:
Establishing the broader market direction.
Identifying a potential turning point or continuation area.
Waiting for confirmation instead of entering solely because price has reached a level.
Placing a stop according to the structure of the setup.
Planning an exit near a relevant swing high, swing low, or other predefined target.
Assume GBP/USD is trending upward on the four-hour chart. The price pulls back toward a previous support zone and forms a bullish rejection candle. The broader market structure remains intact, with the latest major swing low still holding.
A swing trader could consider a long entry after bullish confirmation, place a stop-loss below the support zone, and set a target near the previous swing high. This approach aims to capture a price move lasting several hours or days rather than a few minutes.
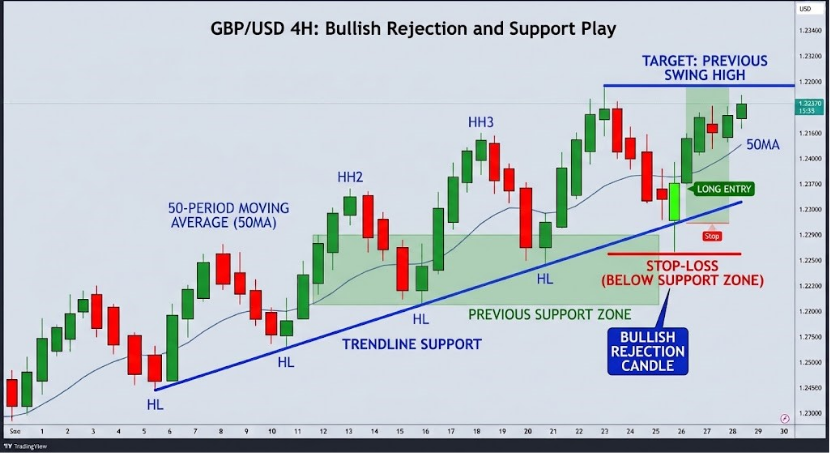
Why it works: The entry is based on a pullback within an established structure, with a visible level for defining risk and a potential target based on the previous high.
Common Mistakes
Beginners often monitor positions too frequently, abandon their plan after small fluctuations, or overlook the costs of holding trades overnight.
Swing trading does not eliminate risk simply because it involves fewer trades. A single position can still produce a substantial loss if its size is excessive.
Breakout Trading Strategy for Beginners
Breakout trading focuses on price moving beyond an established trading range, support level, resistance level, or chart formation. The underlying idea is that a decisive move beyond a widely watched price area may indicate a change in buying or selling pressure.
How to Identify a Breakout
Look for a period during which price repeatedly approaches a similar ceiling or floor.
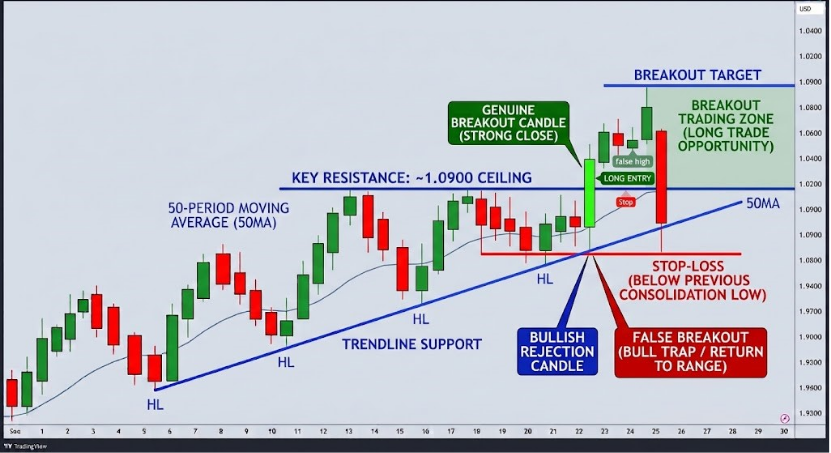
For example, suppose EUR/USD has struggled to move above 1.0900 several times. A later move above that level may attract breakout traders.
However, a brief move beyond resistance does not automatically indicate a genuine breakout. Price can quickly return to the previous range, creating a false breakout.
Entry and Exit Rules
Beginners can evaluate a breakout using the following process:
Identify a clear support or resistance boundary.
Wait for price to move beyond the boundary.
Assess whether the breakout candle closes beyond the level.
Consider waiting for a retest of the broken level.
Define the stop-loss and profit-taking plan before entering.
Suppose EUR/USD has traded between 1.0800 and 1.0850 for several sessions. The upper boundary at 1.0850 has repeatedly limited upward movement. Eventually, a four-hour candle closes above this level, and the next candle holds above the former resistance rather than immediately falling back into the range.
A breakout trader could consider entering after the close or after a successful retest of 1.0850. A stop-loss could be placed below the retest low, with a profit target determined before entry.
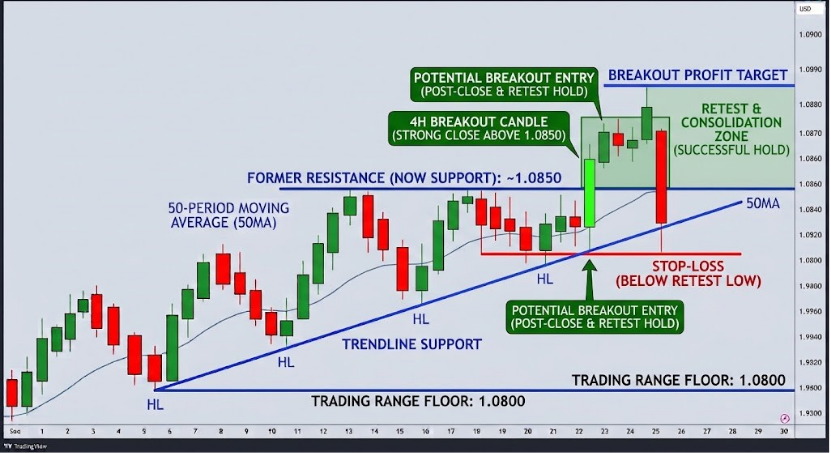
Why it works: The price has moved beyond a clearly defined trading range, and the retest provides additional evidence that buyers may be defending the breakout area. However, neither a candle close nor a retest guarantees continuation.
Common Mistakes
Entering immediately after a large candle can mean paying an unfavourable price. Other mistakes include trading every minor breakout and ignoring major economic announcements.
Breakout strategies require particular attention to spreads, slippage, and sudden price changes.
Support and Resistance Strategy for Beginners
Support and resistance are price areas where buying or selling pressure has previously influenced market behaviour.
Support is an area where downward movement has previously slowed or reversed. Resistance is an area where upward movement has previously struggled.
These levels are not guaranteed barriers. They are reference points for analysing how price may behave.
How to Identify Support and Resistance
Start by looking for areas where price has reversed or consolidated more than once. Previous swing highs and lows, round-number price levels, and former breakout areas can provide useful references.
It is usually better to treat these as zones rather than exact lines. Markets do not always reverse at a precise price.
Entry and Exit Rules
There are two common approaches.
Trading a rejection: If price approaches support and shows signs of rejecting lower prices, a trader may evaluate a potential long position. The setup should be reconsidered if price breaks decisively below the relevant support zone.
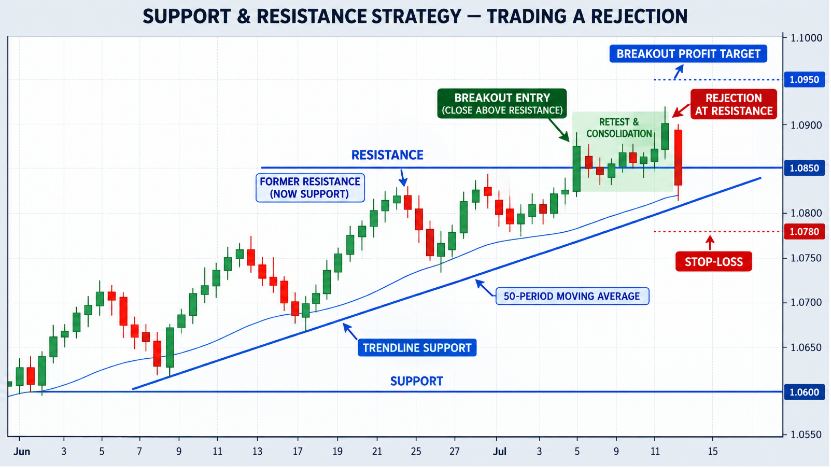
Trading a breakout and retest: If price breaks above resistance and subsequently holds that area, a trader may evaluate a potential long entry. A return below the former resistance may weaken the setup.
In both cases, the entry should depend on observable price behaviour rather than the assumption that a level must hold.
Suppose GBP/USD has repeatedly found buying interest around 1.2600. Each time the price approaches this area, selling slows and buyers push the market higher. On a later test, the price dips toward 1.2600, forms a bullish rejection candle, and closes back above the zone.
A trader could consider a long position after the rejection is confirmed. A stop-loss might sit below the recent low, while a target could be set near the next resistance area around 1.2700.
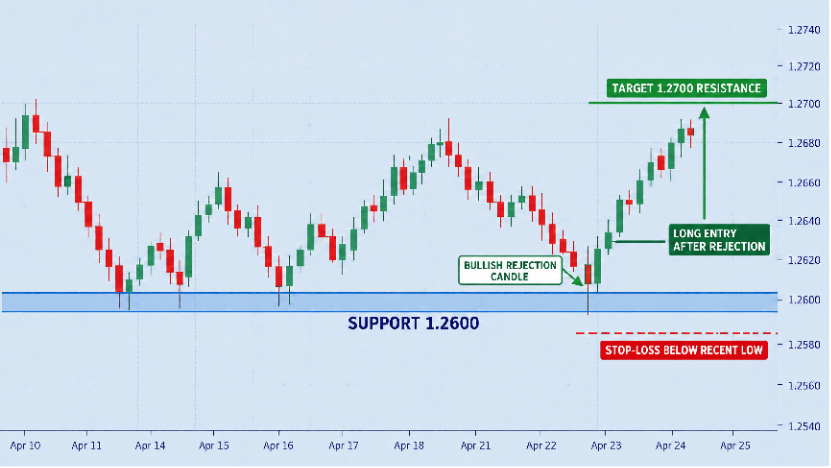
Why it works: The trade is based on a previously observed area of buying interest and a new reaction from that area. Support and resistance are better treated as zones than as perfectly precise prices.
Common Mistakes
Beginners may draw too many levels, interpret every small reversal as significant, or enter trades without confirmation.
Support and resistance work best as part of a broader trading plan that includes market direction, volatility, and risk management.
Moving Average Strategy for Beginners
A moving average smooths historical price data to make the broader direction easier to observe. It can help traders assess trend direction and identify potential pullbacks, although it is based on past prices and reacts with a delay.
Two common types are the simple moving average (SMA) and the exponential moving average (EMA). An EMA gives greater weight to recent prices, while an SMA calculates the average over the selected period.
How to Read Moving Averages
Some traders use a shorter-period moving average alongside a longer-period average.
For example, a trader might use a 20-period EMA to observe shorter-term price behaviour and a 50-period EMA to assess the broader trend. These periods are illustrative choices, not universally optimal settings.
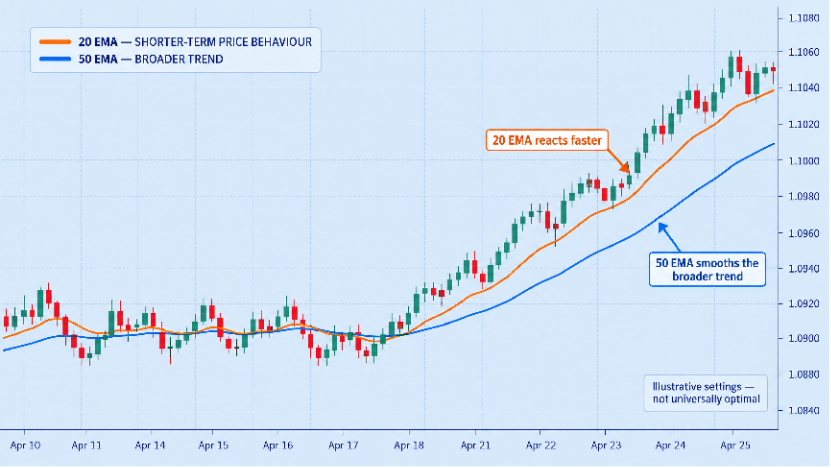
When price remains above a rising moving average, the market may have an upward bias. When price remains below a falling average, the bias may be downward.
Entry and Exit Rules
A simple moving-average strategy mainly involves:
Confirming the overall direction using a longer-period average.
Waiting for price to pull back toward a shorter-period average.
Looking for evidence that price is resuming the broader direction.
Defining a stop-loss based on market structure.
Exiting according to a predefined target or a change in the trading setup.
A moving-average crossover can also be used as a signal, but crossovers often occur after a significant portion of a move has already happened.
Imagine EUR/USD has been trading sideways before beginning a sustained upward move. On the four-hour chart, the 20-period moving average crosses above the 50-period moving average. Both averages begin to slope upward, and the price remains above them during a subsequent pullback.
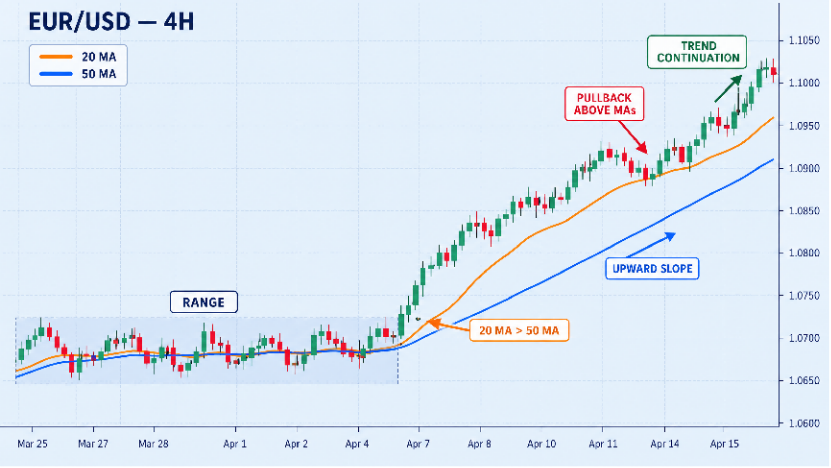
A beginner following a crossover strategy could wait for the crossover candle to close, then look for a possible long entry if the broader price structure supports the signal. A stop-loss could be placed below a recent swing low.
Why it works: The crossover suggests that recent prices are strengthening relative to the longer lookback period. The upward slopes and supporting price structure provide additional context beyond the crossover alone.
Common Mistakes
Moving averages tend to produce repeated false signals in sideways markets. Beginners may also assume that a moving average acts as guaranteed support or resistance.
Before using any settings with real capital, traders should test them across different market conditions and include realistic transaction costs.
How Should Beginners Choose a Trading Strategy?
The most appropriate strategy depends on the time available, the market environment, and the trader's ability to follow predefined rules. Before selecting a trade, ask yourself:
Time: Can I monitor and manage this strategy according to its rules?
Market: Are the current conditions consistent with the setup I have tested?
Execution: Can I follow the entry, stop-loss, and exit rules without improvising?
Risk: Is the potential loss acceptable if the trade fails?

Rather than learning all seven methods simultaneously, beginners can choose one approach and develop clear rules for identifying, entering, and exiting trades. This is an much easier way.
A useful next step is to test the strategy on historical charts, then practise in a demo account. Record the entry reason, stop-loss, target, transaction costs, and outcome for each trade. Review a sufficiently large sample instead of judging a strategy based on only a handful of results.
The Bottom Line
Trading strategies provide a framework for interpreting market behaviour, but no strategy works in every market condition. Trend following may struggle in a range, while range trading can fail when a strong breakout develops.
For beginners, the priority should be learning how to recognise the market environment, define an entry and exit plan, and manage the amount at risk. Technical indicators and chart patterns are tools for decision-making, not guarantees of future price movements.
Risk Warning: Forex and CFD trading involve significant risk and may not be suitable for all investors. Leverage magnifies both profits and losses. This article is for educational purposes only and does not constitute investment advice or a recommendation to trade any financial instrument.
FAQ
Which trading strategy is easiest to learn?
Support and resistance trading can help beginners identify potential entry and exit levels.
Can beginners make money with simple trading strategies?
Yes, but profits are never guaranteed. Risk management and consistent execution are essential.
How should beginners choose a trading strategy?
Consider your available time, trading goals, risk tolerance, and ability to follow a trading plan.