
Using multiple timeframes means examining the same market on two or more chart intervals, with each chart serving a specific purpose.
Rather than switching randomly between charts, beginners can assign a clear role to each timeframe. For example, a trader might use the daily chart for market context, the H4 chart to identify a potential setup, and the H1 chart to examine an entry signal.
A simple three-step process is:
Step 1: Identify the broader market structure.
Start with the daily chart. Look for the general direction of price, major swing highs and lows, and significant support or resistance zones. Avoid assuming that the market must continue in its current direction.
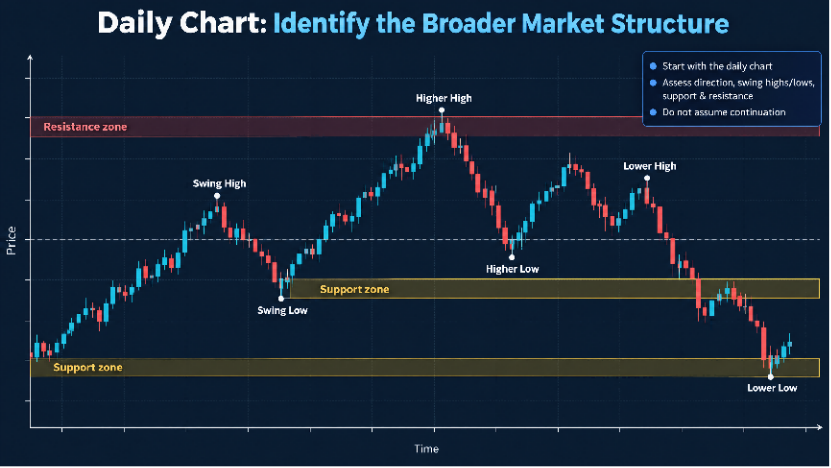
Step 2: Look for a potential setup.
Move to the H4 chart. Examine whether the price is approaching a relevant level, forming a pullback, or developing a recognizable pattern that matches your trading strategy.
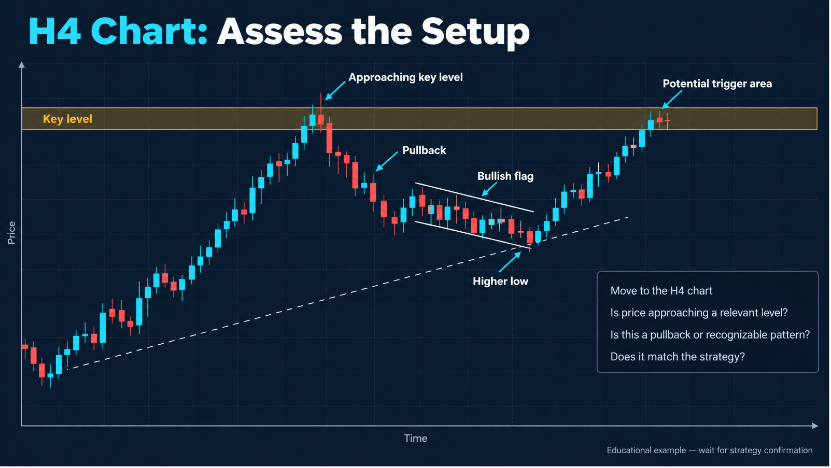
Step 3: Check the entry conditions.
Use the H1 chart if your strategy requires more precise entry confirmation. For example, you might wait for a candle to close above a short-term resistance level before considering a long position.
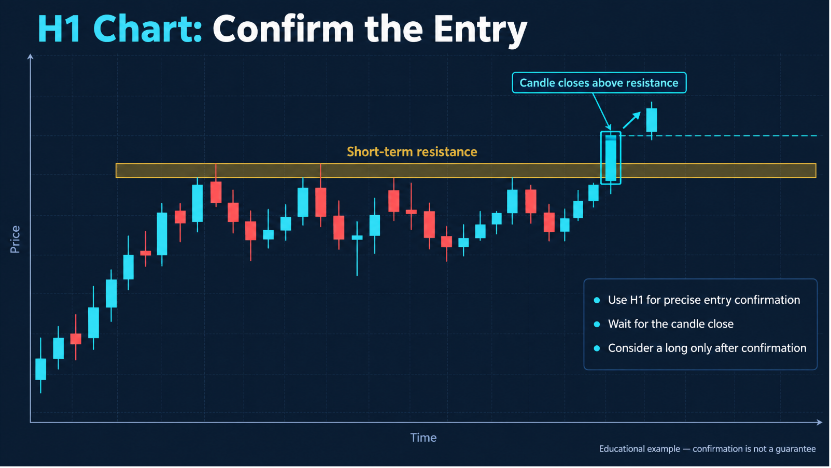
This approach can help separate broad market analysis from entry decisions. However, adding more timeframes does not necessarily improve a strategy. Too many charts can create conflicting signals and encourage traders to select whichever chart supports their preferred decision.
How Many Timeframes Should A Beginner Use?
For many beginners, starting with one primary timeframe is sufficient. Once they understand how their chosen strategy works, they can experiment with adding one higher timeframe for context.
A simple two-timeframe approach might use H4 to identify the market structure and H1 to examine potential entries. A more experienced beginner may eventually add D1 for broader context, provided each chart has a clear purpose.
The key is consistency. If your rules say that the H4 chart determines the setup, a brief movement against your position on the M15 chart should not automatically invalidate that setup. Before adding another timeframe, ask yourself whether it provides new information that improves a specific decision. If it does not, the extra chart may add complexity rather than value.
Do Higher Timeframes Have Less Noise?
Generally, higher timeframes smooth out many short-lived price fluctuations that are visible on lower timeframes. This can make broader trends and important price levels easier to identify.
Let’s say, EUR/USD, is trading within a broader range of 1.0750–1.0800 over several days.
On the M5 chart: The price rises from 1.0770 to 1.0800, then falls toward 1.0770 before rising again. A beginner might interpret each move as a new trend or reversal and enter trades too frequently.
On the H4 chart: Those same movements appear as smaller fluctuations within the broader 1.0750–1.0800 range. Rather than signaling a clear new trend, the price is repeatedly moving between support and resistance.
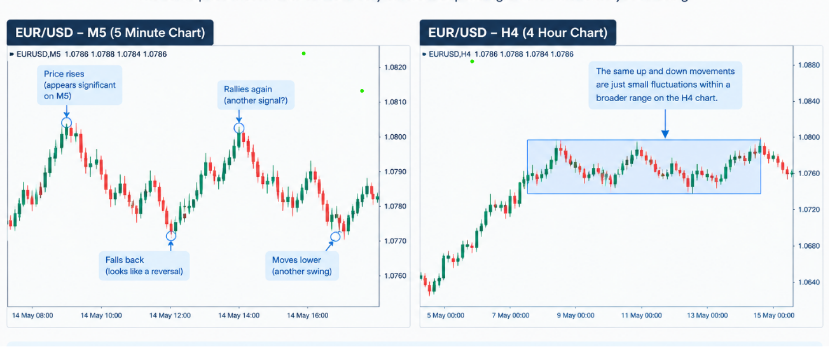
Note: The prices and charts are illustrative examples, not historical market data or trading signals.
What does this mean for beginners? The M5 chart shows short-term price movements in greater detail, while the H4 chart helps traders understand the broader market structure. Looking at both can help beginners avoid mistaking every small price swing for a meaningful trend change.
However, less visible noise does not mean less risk or more reliable profits.
Higher timeframes may conceal important short-term movements, and their candles can represent wider price ranges. A daily candle can include substantial intraday volatility even though it appears as a single bar.
Lower timeframes also have legitimate uses. They can help traders examine entry conditions more closely, although short-term signals may be more sensitive to spread costs, execution differences, and temporary price movements.
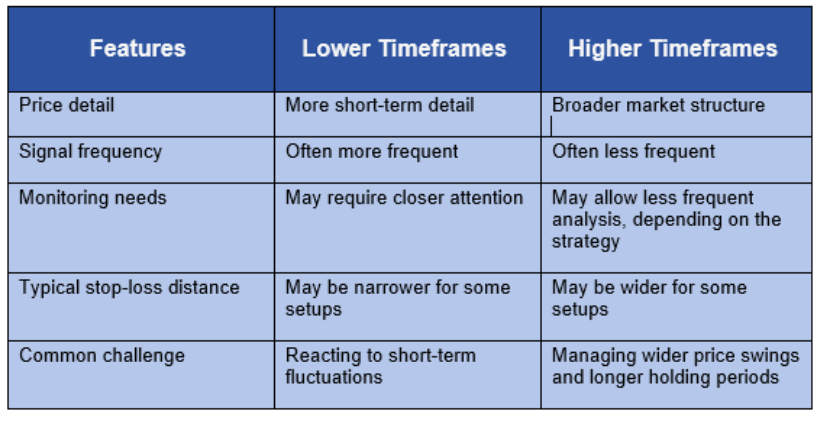
These are general tendencies, not fixed rules. Actual behavior depends on the instrument, market conditions, and strategy being used.
Does Timeframe Affect Stop Loss?
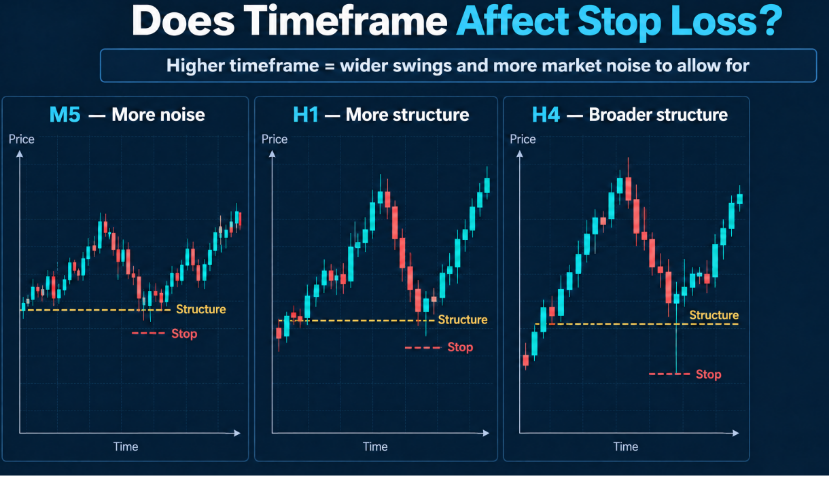
Yes. The timeframe can influence where a technically meaningful stop-loss level is located, but it does not determine the monetary amount you must risk on a trade.
A stop-loss is often placed at a level where the original trade idea would no longer be valid. For a short-term setup, that might be below a nearby swing low. For a higher-timeframe setup, the relevant swing low may be much farther away.
Consider a hypothetical trading account with a balance of $2,000. A trader chooses to risk 1% of the account on a single trade.
The planned monetary risk is:
$2,000 × 1% = $20
Now compare two hypothetical setups on the same instrument:
Setup A: The stop-loss is 20 pips away.
Setup B: The stop-loss is 50 pips away.
If the trader intends to keep the planned risk at $20, Setup B generally requires a smaller position size than Setup A, assuming the same pip value conventions and ignoring additional costs.
The general calculation is:
Position size = Planned monetary risk ÷ (Stop-loss distance × monetary value per pip per unit of position size)
The exact calculation depends on the instrument, account currency, contract specifications, and broker's position-sizing conventions.
This example highlights an important principle: do not choose an artificially tight stop-loss simply to increase position size. The stop should reflect the strategy's invalidation point, while position size should be adjusted to fit the planned risk.
Also remember that stop-loss orders may be executed at a different price during gaps or fast-moving markets. A stop-loss can help manage risk, but it cannot guarantee that the final loss will equal the planned amount.
Common Timeframe Mistakes Beginners Should Avoid

Choosing an appropriate chart interval is only part of the process. Beginners should also avoid these common mistakes.
Switching timeframes after every losing trade
A loss does not automatically mean that the selected timeframe is wrong. Review whether the trade followed your rules and whether the strategy has been tested across a meaningful sample of trades.
For instance, buying EUR/USD at a 1.0800 support level on the 1-hour chart may hit your stop-loss despite a valid bullish rejection candle. However, if your entry strictly followed your rules and your trading log shows a 64% win rate across 50 backtested trades, this single loss is merely expected statistical variance. The 1-hour timeframe remains valid, and the strategy should be taken on the next signal.
Assuming more signals mean more opportunities
Shorter charts may produce more apparent setups, but those setups still need to meet your entry criteria and account for trading costs.
Using a stop-loss that does not fit the setup
A stop-loss should reflect the market structure and the point at which the trade idea is invalidated. Position size should then be adjusted to control the planned monetary risk.
Ignoring your daily schedule
A strategy that requires constant monitoring may not be practical if you can only check the market a few times a day. Select a timeframe that you can realistically follow.
Confusing a chart timeframe with a guaranteed holding period
A trade identified on an H4 chart may close sooner than expected, while a trade based on an M15 chart may remain open longer than one session. Your strategy and exit rules determine the intended holding period.
Practical Tips for Choosing Your First Trading Timeframe
Before committing to a timeframe, this checklist can help to assess whether it suits your circumstances.
I know how long I can realistically spend monitoring the market.
I have selected a trading style that matches my available time.
I understand how my strategy identifies an entry and an invalidation point.
I can calculate a position size based on stop-loss distance and planned monetary risk.
I have tested the strategy on historical charts or in a demo account.
I can follow the same timeframe rules consistently without reacting to every price movement.
If you are unsure where to begin, consider studying the H1 and H4 charts first, then compare them with the daily chart to understand the broader market structure. Choose one primary timeframe for your practice and keep a record of your results before deciding whether to change it.
The Bottom Line
Overall, the best trading timeframe for beginners is the one that fits a clearly defined strategy and can be followed consistently. Shorter charts provide more detail but may require faster decisions. Higher charts can make broader trends easier to identify but may involve wider price swings and longer holding periods.
Searching for a perfect timeframe is not practical. Usually, begin by identifying your available trading time and preferred holding period. Select one primary chart, establish entry and exit rules, and test those rules through historical analysis or demo trading.
Most importantly, separate the choice of timeframe from the decision about how much money to risk. A chart can help you interpret the market, but consistent risk management and disciplined execution remain essential regardless of the timeframe you choose.
Risk warning: Trading forex and CFDs involves significant risk and may result in losses that exceed expectations. Leverage magnifies both gains and losses. This article is for educational purposes only and does not constitute investment advice.
Frequently Asked Questions
What is the best trading timeframe for beginners?
There is no universally best timeframe. H1, H4, and D1 are useful starting points to explore because they show different levels of market detail. The right choice depends on your trading style, available time, risk management, and ability to follow a consistent plan.
Is the 5-minute chart suitable for beginners?
It can be, but the M5 chart often requires closer attention and more frequent decisions. Beginners should learn a clearly defined strategy, account for transaction costs, and practice before using real money.
Is the 4-hour chart better than the 1-hour chart?
Neither is inherently better. H4 provides a broader view of market structure, while H1 shows more intraday detail. A trader may use H4 to identify a setup and H1 to examine an entry, provided this combination fits the strategy.
How many timeframes should a beginner use?
Starting with one primary timeframe is reasonable. Adding a higher timeframe can help provide context, but each chart should have a specific role. Using too many timeframes may create confusion rather than improve decisions.
Do higher timeframes reduce trading risk?
Not automatically. Higher timeframes may make broader market structure easier to interpret, but trades can still experience substantial price movements, gaps, and losses. Risk depends on position size, stop-loss placement, execution, and market conditions.