- WTI trades just above $80.00, down 1.69% and beneath its 50-day average.
- US Crude Oil stocks up 17.4 million barrels, the biggest build since January 2023.
- IEA has the market 1.8 million barrels a day short this quarter.
The largest weekly build in American Crude Oil inventories in three and a half years landed on Wednesday into a market that two forecasting agencies spent the same morning describing as physically short, and the barrel has been selling since. West Texas Intermediate (WTI) trades just above $80.00, down 1.69%, after a session that ran from just through the $82.00 handle to a flush short of $79.50 and then handed back most of the rebound.
Reconciling those two facts is the day's entire job, because the build is real, the shortage is real, and both hold at once only because the barrels are in the wrong ocean. Commercial stocks rose to 424.4 million barrels in the week ended August 7 against a polled expectation of a 1.4 million barrel draw, and even after that jump they sit around 2% beneath the five-year average.
A build that is really a traffic jam
Exports slumped while imports rose by 1.14 million barrels a day to 7.3 million, and cargo-tracking analysis puts the vast majority of the accumulation on the Gulf Coast. Refineries ran at 96.2% of operable capacity, so nothing in the release describes Americans consuming less. This is a cargo that could not leave the country.
The refined product data declined to corroborate any of it, which is the tell that separates a glut from a bottleneck. Gasoline inventories fell to 208.7 million barrels and sit 6% under the five-year average, distillates slipped to 107.1 million and sit roughly 12% under it, and European refining margins set fresh records this month. A market drowning in barrels does not price diesel that way.
Two agencies subtract the same demand
The International Energy Agency (IEA) now expects Crude Oil demand to contract by 1.6 million barrels a day across 2026, a decline 510K barrels a day deeper than the one it published in July. The Organization of the Petroleum Exporting Countries (OPEC) moved the same way on the same Wednesday, trimming its 2026 growth estimate to roughly 600K barrels a day from 780K.
Both numbers describe demand destroyed by price and by a shut waterway rather than demand lost to a soft economy, which is why the same report has the market short 1.8 million barrels a day this quarter. Gulf production recovered a further 2.5 million barrels a day in July to 23.9 million and still runs 8.3 million beneath its pre-conflict rate. The supply hole remains the larger number.
The war gets bigger and the barrel gets cheaper
Central Command spent Thursday announcing its first multi-domain, multinational attack drone task force, an expansion of the one-way attack squadron it stood up nine months ago. The War Secretary said separately from Panama that the naval blockade of Iranian ports can be sustained indefinitely on ship rotation, and the redirected-vessel count reached 59 as of August 12.
Against all of that, eight vessels transited the Strait of Hormuz on Tuesday, a one-week low, on a route that carried roughly 130 a day before the war began in late February. The theatre commander's own position has been reported two ways inside a fortnight, once as advice to halt a target-exhausted bombing campaign and once, via Israeli television, as support for further strikes. A market handed both readings has stopped paying for either.
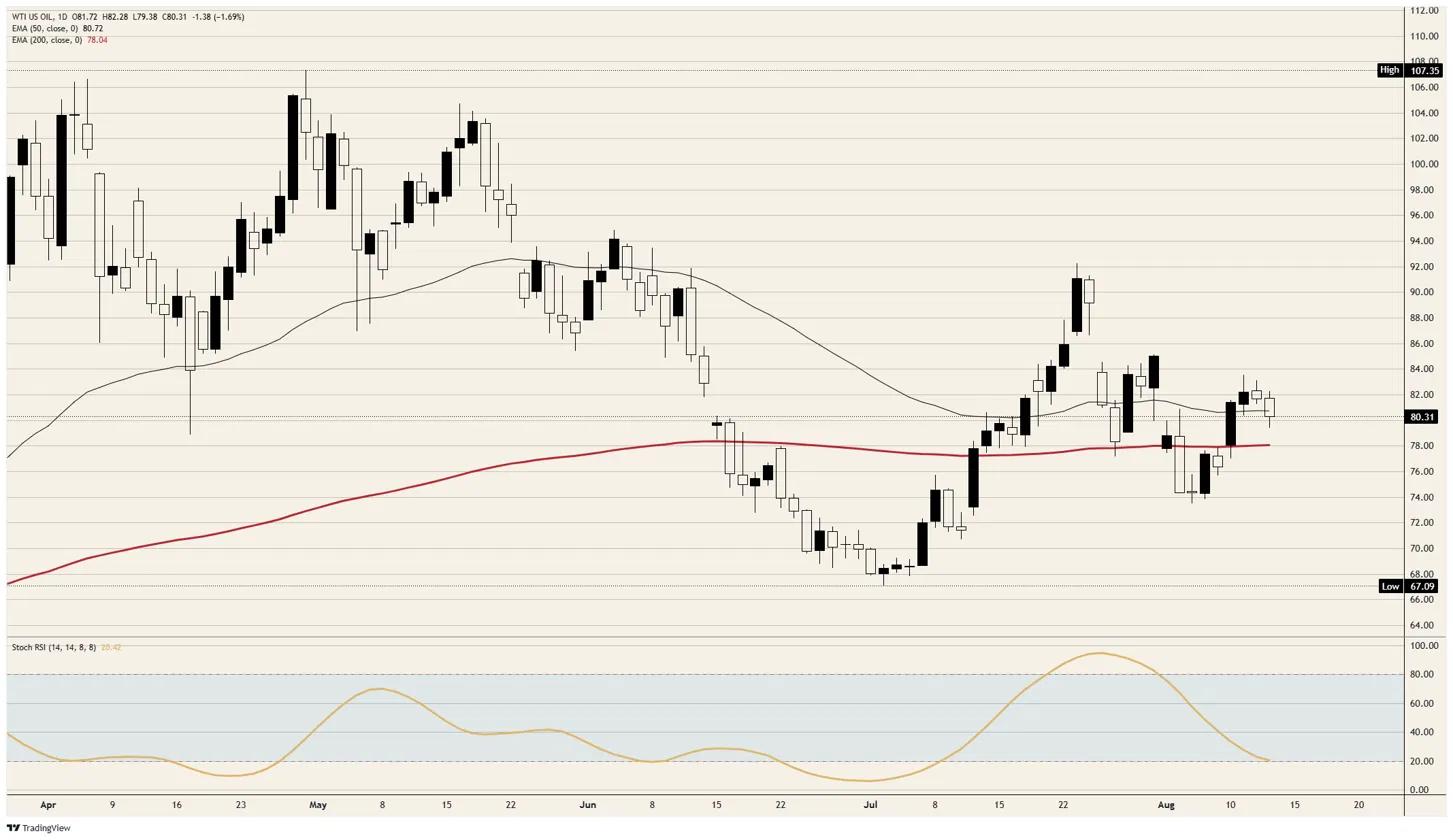
The daily chart priced that indifference weeks ago, since a benchmark that travelled from near $67.00 to near $107.50 across four months has spent the past fortnight inside roughly $8.00. It has built a rising sequence of lows off the June trough while the war headlines grew louder, and today's decline reads as noise inside that compression rather than a break of it.
The one date that still carries a price
Monday is the only entry on this calendar with a genuine premium attached, because the 60-day negotiating window written into June's memorandum expires on August 17. An Iranian official told wires on Wednesday that Tehran sees nothing left to extend, while Washington claims total control of the strait and Tehran's foreign minister calls that a miscalculation. Selling into a hard-dated fuse with two sessions left is a position rather than a view.
What the calendar still owes this week
July producer prices arrived flat in the 12:30 GMT block against a 0.2% consensus, with the annual rate at 4.7% and the core measure up 0.2% against 0.3% expected. That relief was bought at the pump and the terminal: gasoline fell 5.7%, diesel fell 6.7% and accounted for more than half the decline in intermediate demand, and unprocessed energy materials fell 7.4%.
The month being measured is the one in which this benchmark peaked near $91.50 in late July, which is the recurring defect in energy-led inflation prints: they describe a tape already overwritten. Two regional Federal Reserve presidents speak into the same session, and Friday brings retail sales at 12:30 GMT against a 0.2% consensus and consumer sentiment at 14:00 GMT, seen at 54 from 55.2.
Levels
Resistance: The 50-day exponential moving average (EMA) at $80.72 sits immediately overhead after spot slipped beneath it, with the $81.50 area above that and the $82.00 handle where the day's high printed just through. A sustained move above $82.00 opens $82.50.
Support: The $80.00 handle is the first shelf beneath spot, then the day's low short of $79.50, then the 200-day EMA at $78.04, which was pierced and reclaimed during the early-August washout toward $74.00. The Stochastic Relative Strength Index (Stoch RSI) on the daily frame sits at 20.42 and is still falling, which argues for one more probe lower before the range reasserts.
Bias: Bullish while the 200-day EMA at $78.04 holds. A near-record inventory build that is a logistics artifact, a balance sheet the agencies themselves call short, and a hard deadline on Monday do not add up to a barrel that stays beneath its 50-day average for long. Objectives are the $82.00 handle then $82.50, with invalidation on a daily close beneath $78.00.
WTI daily chart
WTI Oil FAQs
WTI Oil is a type of Crude Oil sold on international markets. The WTI stands for West Texas Intermediate, one of three major types including Brent and Dubai Crude. WTI is also referred to as “light” and “sweet” because of its relatively low gravity and sulfur content respectively. It is considered a high quality Oil that is easily refined. It is sourced in the United States and distributed via the Cushing hub, which is considered “The Pipeline Crossroads of the World”. It is a benchmark for the Oil market and WTI price is frequently quoted in the media.
Like all assets, supply and demand are the key drivers of WTI Oil price. As such, global growth can be a driver of increased demand and vice versa for weak global growth. Political instability, wars, and sanctions can disrupt supply and impact prices. The decisions of OPEC, a group of major Oil-producing countries, is another key driver of price. The value of the US Dollar influences the price of WTI Crude Oil, since Oil is predominantly traded in US Dollars, thus a weaker US Dollar can make Oil more affordable and vice versa.
The weekly Oil inventory reports published by the American Petroleum Institute (API) and the Energy Information Agency (EIA) impact the price of WTI Oil. Changes in inventories reflect fluctuating supply and demand. If the data shows a drop in inventories it can indicate increased demand, pushing up Oil price. Higher inventories can reflect increased supply, pushing down prices. API’s report is published every Tuesday and EIA’s the day after. Their results are usually similar, falling within 1% of each other 75% of the time. The EIA data is considered more reliable, since it is a government agency.
OPEC (Organization of the Petroleum Exporting Countries) is a group of 12 Oil-producing nations who collectively decide production quotas for member countries at twice-yearly meetings. Their decisions often impact WTI Oil prices. When OPEC decides to lower quotas, it can tighten supply, pushing up Oil prices. When OPEC increases production, it has the opposite effect. OPEC+ refers to an expanded group that includes ten extra non-OPEC members, the most notable of which is Russia.

'%3e%3cmask%20id='mask0_5439_346'%20style='mask-type:luminance'%20maskUnits='userSpaceOnUse'%20x='0'%20y='0'%20width='32'%20height='32'%3e%3cpath%20d='M32%200H0V32H32V0Z'%20fill='white'/%3e%3c/mask%3e%3cg%20mask='url(%23mask0_5439_346)'%3e%3cpath%20d='M0%2010.7333C0%206.9367%200%205.0384%200.750577%203.59349C1.38308%202.37587%202.37588%201.38307%203.5935%200.750574C5.03842%200%206.93673%200%2010.7333%200H21.2667C25.0633%200%2026.9616%200%2028.4065%200.750574C29.624%201.383%2030.6167%202.37566%2031.2492%203.59311C31.249%203.5927%2031.2494%203.59351%2031.2492%203.59311C31.9996%205.03796%2032%206.93705%2032%2010.7333V21.2666C32%2025.0631%2032%2026.9615%2031.2494%2028.4064C30.617%2029.624%2029.6241%2030.6167%2028.4065%2031.2493C26.9616%2031.9999%2025.0633%2031.9999%2021.2667%2031.9999H10.7333C6.93673%2031.9999%205.03842%2031.9999%203.5935%2031.2493C2.37588%2030.6167%201.38308%2029.624%200.750577%2028.4064C0%2026.9615%200%2025.0631%200%2021.2666V10.7333Z'%20fill='url(%23paint0_linear_5439_346)'/%3e%3cpath%20d='M22.2222%2020.4448L22.9334%2016.0004H18.6667V12.8893C18.6667%2011.6448%2019.1112%2010.667%2021.0667%2010.667H23.1112V6.57821C21.9556%206.40043%2020.7112%206.22266%2019.5556%206.22266C15.9112%206.22266%2013.3334%208.44486%2013.3334%2012.4448V16.0004H9.33337V20.4448H13.3334V32.0004C15.1112%2032.0004%2016.8889%2032.0004%2018.6667%2032.0004V20.4448H22.2222Z'%20fill='white'/%3e%3c/g%3e%3c/g%3e%3cdefs%3e%3clinearGradient%20id='paint0_linear_5439_346'%20x1='16'%20y1='31.0649'%20x2='16'%20y2='0'%20gradientUnits='userSpaceOnUse'%3e%3cstop%20stop-color='%230062E0'/%3e%3cstop%20offset='1'%20stop-color='%2319AFFF'/%3e%3c/linearGradient%3e%3cclipPath%20id='clip0_5439_346'%3e%3crect%20width='32'%20height='32'%20fill='white'/%3e%3c/clipPath%3e%3c/defs%3e%3c/svg%3e)
'%3e%3cmask%20id='mask0_5439_355'%20style='mask-type:luminance'%20maskUnits='userSpaceOnUse'%20x='0'%20y='0'%20width='32'%20height='32'%3e%3cpath%20d='M32%200H0V32H32V0Z'%20fill='white'/%3e%3c/mask%3e%3cg%20mask='url(%23mask0_5439_355)'%3e%3cpath%20d='M24%200H8C3.58172%200%200%203.58172%200%208V23.9999C0%2028.4181%203.58172%2031.9999%208%2031.9999H24C28.4183%2031.9999%2032%2028.4181%2032%2023.9999V8C32%203.58172%2028.4183%200%2024%200Z'%20fill='black'/%3e%3cpath%20d='M24%200.5H8C3.85786%200.5%200.5%203.85786%200.5%208V23.9999C0.5%2028.142%203.85786%2031.4999%208%2031.4999H24C28.1421%2031.4999%2031.5%2028.142%2031.5%2023.9999V8C31.5%203.85786%2028.1421%200.5%2024%200.5Z'%20stroke='white'/%3e%3cpath%20d='M13.894%2013.008V12.02C13.5581%2011.9658%2013.2183%2011.939%2012.878%2011.94C8.71558%2011.9422%205.3406%2015.3136%205.33398%2019.476C5.33398%2022.042%206.61799%2024.286%208.56998%2025.65C7.26387%2024.2605%206.53711%2022.425%206.53798%2020.518C6.50998%2016.43%209.79998%2013.088%2013.894%2013.008Z'%20fill='%2300F2EA'/%3e%3cpath%20d='M14.08%2023.9922C15.928%2023.9922%2017.452%2022.5222%2017.532%2020.6782V4.2422H20.528C20.476%203.8942%2020.422%203.5482%2020.422%203.2002H16.328V19.6362C16.2549%2021.4883%2014.7315%2022.9516%2012.878%2022.9502C12.288%2022.9502%2011.754%2022.8182%2011.272%2022.5502C11.914%2023.4302%2012.932%2023.9922%2014.082%2023.9922H14.08Z'%20fill='%2300F2EA'/%3e%3cpath%20d='M23.016%207.98414C22.1109%206.94944%2021.6163%205.61885%2021.626%204.24414H20.528C20.8136%205.77756%2021.7121%207.12822%2023.016%207.98414ZM12.878%2016.0561C10.978%2016.0561%209.42603%2017.6061%209.42603%2019.5021C9.42603%2020.8401%2010.176%2021.9881%2011.272%2022.5501C10.872%2021.9901%2010.632%2021.2941%2010.632%2020.5461C10.632%2018.6461%2012.182%2017.0981%2014.082%2017.0981C14.428%2017.0981%2014.776%2017.1501%2015.098%2017.2581V13.0601C14.7621%2013.0059%2014.4223%2012.9792%2014.082%2012.9801H13.894V16.1861C13.5619%2016.1012%2013.2208%2016.0569%2012.878%2016.0541V16.0561Z'%20fill='%23FF004F'/%3e%3cpath%20d='M26.1459%209.82812V13.0081C24.098%2013.0202%2022.1005%2012.3737%2020.4479%2011.1641V19.5041C20.444%2022.317%2018.8763%2024.8944%2016.3802%2026.1914C13.8842%2027.4884%2010.874%2027.2898%208.56995%2025.6761C10.0041%2027.2091%2012.0087%2028.08%2014.1079%2028.0821C18.2704%2028.0799%2021.6453%2024.7085%2021.6519%2020.5461V12.2061C23.3129%2013.4007%2025.306%2014.0455%2027.3519%2014.0501V9.93412C26.9219%209.93412%2026.5219%209.90813%2026.1459%209.82812Z'%20fill='%23FF004F'/%3e%3cpath%20d='M20.42%2019.5041V11.1641C22.0809%2012.3588%2024.0741%2013.0037%2026.12%2013.0081V9.82814C24.9151%209.56028%2023.8275%208.91415%2023.016%207.98414C21.6999%207.13572%2020.7907%205.78321%2020.502%204.24414H17.532V20.6801C17.4579%2022.5314%2015.9348%2023.9936%2014.082%2023.9921C12.9678%2023.992%2011.9219%2023.4552%2011.272%2022.5501C10.1428%2021.9521%209.43358%2020.7819%209.42601%2019.5041C9.42601%2017.6041%2010.978%2016.0561%2012.878%2016.0561C13.226%2016.0561%2013.572%2016.1081%2013.894%2016.2161V13.0081C9.79024%2013.0899%206.50702%2016.4416%206.51001%2020.5461C6.51001%2022.5241%207.28601%2024.3401%208.54401%2025.6761C9.81533%2026.563%2011.3279%2027.0391%2012.878%2027.0401C17.0441%2027.0468%2020.4242%2023.6702%2020.422%2019.5041H20.42Z'%20fill='white'/%3e%3c/g%3e%3c/g%3e%3cdefs%3e%3cclipPath%20id='clip0_5439_355'%3e%3crect%20width='32'%20height='32'%20fill='white'/%3e%3c/clipPath%3e%3c/defs%3e%3c/svg%3e)
'%3e%3cmask%20id='mask0_5439_373'%20style='mask-type:luminance'%20maskUnits='userSpaceOnUse'%20x='0'%20y='0'%20width='32'%20height='32'%3e%3cpath%20d='M32%200H0V32H32V0Z'%20fill='white'/%3e%3c/mask%3e%3cg%20mask='url(%23mask0_5439_373)'%3e%3cpath%20d='M24%200H8C3.58172%200%200%203.58172%200%208V24C0%2028.4183%203.58172%2032%208%2032H24C28.4183%2032%2032%2028.4183%2032%2024V8C32%203.58172%2028.4183%200%2024%200Z'%20fill='%230A66C2'/%3e%3cpath%20d='M4.43994%207.80859C4.43994%209.28969%205.64159%2010.4913%207.12269%2010.4913C8.60512%2010.4913%209.80677%209.28969%209.80677%207.80859C9.80677%206.32616%208.60512%205.12451%207.12269%205.12451C5.64159%205.12451%204.43994%206.32616%204.43994%207.80859ZM4.76065%2026.3869H9.48606H9.48739V12.2093H4.76065V26.3869ZM12.5095%2026.3869H17.2841V17.9647C17.2841%2017.9647%2017.6354%2015.7743%2020.0747%2015.7464C22.5139%2015.7184%2022.4034%2017.9647%2022.4034%2017.9647L22.5139%2026.3869H27.2553V17.5469C27.2553%2017.5469%2027.2087%2014.2373%2025.371%2012.9731C23.8415%2011.9196%2022.8618%2011.9064%2022.1366%2011.8967C22.0466%2011.8955%2021.9605%2011.8943%2021.8778%2011.8913C21.1286%2011.8633%2019.3813%2012.0297%2018.3287%2012.7789C17.2748%2013.5281%2017.0872%2014.1655%2017.0872%2014.1655V12.2093H12.5095V14.2759V15.1635V26.3869Z'%20fill='white'/%3e%3c/g%3e%3c/g%3e%3cdefs%3e%3cclipPath%20id='clip0_5439_373'%3e%3crect%20width='32'%20height='32'%20fill='white'/%3e%3c/clipPath%3e%3c/defs%3e%3c/svg%3e)
'%3e%3cpath%20d='M24.5%200.5H8.5C4.08172%200.5%200.5%204.08172%200.5%208.5V24.4999C0.5%2028.9181%204.08172%2032.4999%208.5%2032.4999H24.5C28.9183%2032.4999%2032.5%2028.9181%2032.5%2024.4999V8.5C32.5%204.08172%2028.9183%200.5%2024.5%200.5Z'%20fill='black'/%3e%3cpath%20d='M24.5%200.5H8.5C4.08172%200.5%200.5%204.08172%200.5%208.5V24.4999C0.5%2028.9181%204.08172%2032.4999%208.5%2032.4999H24.5C28.9183%2032.4999%2032.5%2028.9181%2032.5%2024.4999V8.5C32.5%204.08172%2028.9183%200.5%2024.5%200.5Z'%20stroke='white'/%3e%3cpath%20d='M18.2779%2015.0714L25.2278%207.1665H23.5811L17.5439%2014.0288L12.7254%207.1665H7.16663L14.4547%2017.5444L7.16663%2025.8331H8.8133L15.1848%2018.5847L20.2745%2025.8331H25.8332L18.2779%2015.0714ZM16.0218%2017.6355L15.2823%2016.6015L9.40712%208.3812H11.9367L16.6795%2015.0177L17.416%2016.0517L23.5803%2024.6776H21.0507L16.0218%2017.6355Z'%20fill='white'/%3e%3c/g%3e%3cdefs%3e%3cclipPath%20id='clip0_5439_383'%3e%3crect%20width='33'%20height='32.9998'%20fill='white'/%3e%3c/clipPath%3e%3c/defs%3e%3c/svg%3e)
'%3e%3cpath%20d='M24%200H8C3.58172%200%200%203.58172%200%208V24C0%2028.4183%203.58172%2032%208%2032H24C28.4183%2032%2032%2028.4183%2032%2024V8C32%203.58172%2028.4183%200%2024%200Z'%20fill='white'/%3e%3cmask%20id='mask0_5439_390'%20style='mask-type:luminance'%20maskUnits='userSpaceOnUse'%20x='4'%20y='4'%20width='24'%20height='24'%3e%3cpath%20d='M28%204H4V28H28V4Z'%20fill='white'/%3e%3c/mask%3e%3cg%20mask='url(%23mask0_5439_390)'%3e%3cpath%20d='M14%2020V13L20%2016.512L14%2020ZM27.76%2011.667C27.76%2011.667%2027.525%2010.002%2026.806%209.268C25.893%208.305%2024.87%208.301%2024.401%208.245C21.043%208%2016.005%208%2016.005%208H15.995C15.995%208%2010.957%208%207.599%208.245C7.129%208.301%206.107%208.305%205.193%209.268C4.474%2010.002%204.24%2011.668%204.24%2011.668C4.24%2011.668%204%2013.622%204%2015.577V17.412C4%2019.368%204.24%2021.324%204.24%2021.324C4.24%2021.324%204.474%2022.989%205.193%2023.723C6.107%2024.686%207.306%2024.655%207.84%2024.756C9.76%2024.943%2016%2025%2016%2025C16%2025%2021.043%2024.992%2024.401%2024.748C24.871%2024.691%2025.893%2024.687%2026.806%2023.724C27.526%2022.99%2027.76%2021.324%2027.76%2021.324C27.76%2021.324%2028%2019.369%2028%2017.413V15.579C28%2013.623%2027.76%2011.667%2027.76%2011.667Z'%20fill='%23FF0000'/%3e%3c/g%3e%3c/g%3e%3cdefs%3e%3cclipPath%20id='clip0_5439_390'%3e%3crect%20width='32'%20height='32'%20fill='white'/%3e%3c/clipPath%3e%3c/defs%3e%3c/svg%3e)